- Python XlsxWriter Tutorial
- Python XlsxWriter - Home
- Python XlsxWriter - Overview
- Python XlsxWriter - Environment Setup
- Python XlsxWriter - Hello World
- Python XlsxWriter - Important classes
- Python XlsxWriter - Cell Notation & Ranges
- Python XlsxWriter - Defined Names
- Python XlsxWriter - Formula & Function
- Python XlsxWriter - Date and Time
- Python XlsxWriter - Tables
- Python XlsxWriter - Applying Filter
- Python XlsxWriter - Fonts & Colors
- Python XlsxWriter - Number Formats
- Python XlsxWriter - Border
- Python XlsxWriter - Hyperlinks
- Python XlsxWriter - Conditional Formatting
- Python XlsxWriter - Adding Charts
- Python XlsxWriter - Chart Formatting
- Python XlsxWriter - Chart Legends
- Python XlsxWriter - Bar Chart
- Python XlsxWriter - Line Chart
- Python XlsxWriter - Pie Chart
- Python XlsxWriter - Sparklines
- Python XlsxWriter - Data Validation
- Python XlsxWriter - Outlines & Grouping
- Python XlsxWriter - Freeze & Split Panes
- Python XlsxWriter - Hide/Protect Worksheet
- Python XlsxWriter - Textbox
- Python XlsxWriter - Insert Image
- Python XlsxWriter - Page Setup
- Python XlsxWriter - Header & Footer
- Python XlsxWriter - Cell Comments
- Python XlsxWriter - Working with Pandas
- Python XlsxWriter - VBA Macro
- Python XlsxWriter Useful Resources
- Python XlsxWriter - Quick Guide
- Python XlsxWriter - Useful Resources
- Python XlsxWriter - Discussion
Python XlsxWriter - Working with Pandas
Pandas is a popular Python library for data manipulation and analysis. We can use XlsWriter for writing Pandas dataframes into an Excel worksheet.
To learn the features described in this section, we need to install Pandas library in the same environment in which XlsxWriter has been installed.
pip3 install pandas
Using XlsxWriter with Pandas
Let us start with a simple example. First, create a Pandas dataframe from the data from a list of integers. Then use XlsxWriter as the engine to create a Pandas Excel writer. With the help of this engine object, we can write the dataframe object to Excel worksheet.
Example
import pandas as pd
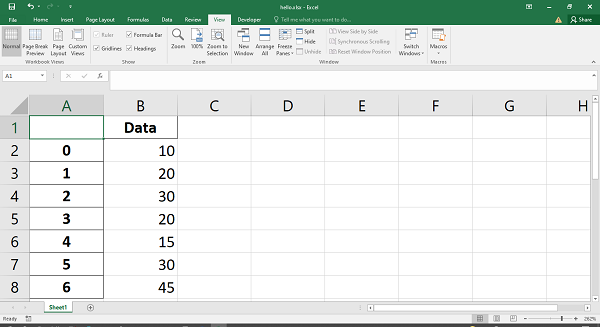
df = pd.DataFrame({'Data': [10, 20, 30, 20, 15, 30, 45]})
writer = pd.ExcelWriter('hello.xlsx', engine='xlsxwriter')
df.to_excel(writer, sheet_name='Sheet1')
writer.save()
Output
The worksheet so created shows up as follows −
Adding Charts to Pandas Dataframe
Just as we obtain an object of Workbook class, and then a Worksheet object by calling its add_worksheet() method, the writer object can also be used to fetch these objects. Once we get them, the XlsxWriter methods to add chart, data table etc. can be employed.
In this example, we set up a Pandas dataframe and obtain its dimension (or shape).
import pandas as pd
df = pd.DataFrame({'Data': [105, 60, 35, 90, 15, 30, 75]})
writer = pd.ExcelWriter('hello.xlsx', engine='xlsxwriter')
df.to_excel(writer, sheet_name='Sheet1')
(max_row, max_col) = df.shape
The workbook and worksheet objects are created from the writer.
workbook = writer.book
worksheet = writer.sheets['Sheet1']
Rest of things are easy. The chart object is added as we have done earlier.
chart = workbook.add_chart({'type': 'column'})
chart.add_series({'values': ['Sheet1', 1, 1, max_row, 1]})
worksheet.insert_chart(1, 3, chart)
writer.save()
Example
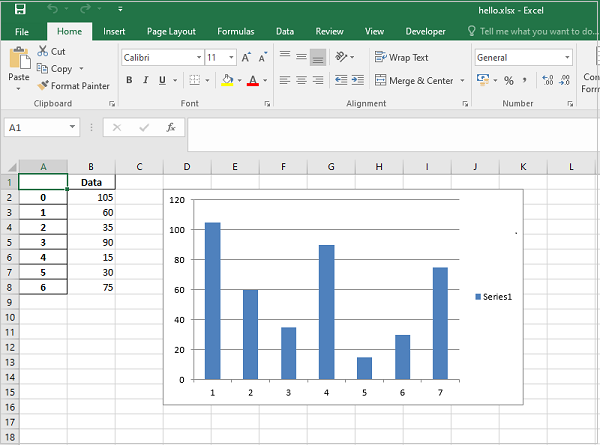
The following code uses Pandas dataframe to write an Excel workbook and a column chart is prepared by XlsxWriter.
import pandas as pd

df = pd.DataFrame({'Data': [105, 60, 35, 90, 15, 30, 75]})
writer = pd.ExcelWriter('hello.xlsx', engine='xlsxwriter')
df.to_excel(writer, sheet_name='Sheet1')
(max_row, max_col) = df.shape

workbook = writer.book
worksheet = writer.sheets['Sheet1']
chart = workbook.add_chart({'type': 'column'})
chart.add_series({'values': ['Sheet1', 1, 1, max_row, 1]})
worksheet.insert_chart(1, 3, chart)

writer.save()
Output
The column chart along with the data is shown below −
Writing Dataframe to Excel Table
Similarly, the dataframe can be written to Excel table object. The dataframe here is derived from a Python dictionary, where the keys are dataframe column headers. Each key has list as a value which in turn becomes values of each column.
import pandas as pd

df = pd.DataFrame({
   'Name': ['Namrata','Ravi','Kiran','Karishma'],
   'Percent': [73.33, 70, 75, 65.5],
   'RollNo': [1, 2,3,4]})

df = df[['RollNo', 'Name', 'Percent']]
(max_row, max_col) = df.shape
Use xlsxwriter engine to write the dataframe to a worksheet (sheet1)
writer = pd.ExcelWriter('hello.xlsx', engine='xlsxwriter')
df.to_excel(writer, sheet_name='Sheet1', startrow=1, header=False, index=False)
Following lines give Workbook and Worksheet objects.
workbook = writer.book
worksheet = writer.sheets['Sheet1']
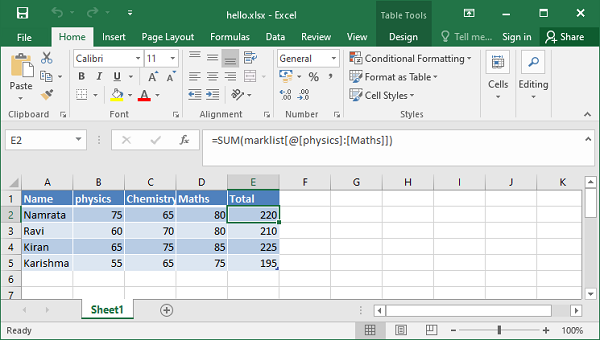
Data in the worksheet is converted to Table with the help of add_table() method.
column_settings = [{'header': column} for column in df.columns]

worksheet.add_table(0, 0, max_row, max_col - 1, {'columns': column_settings})

writer.save()
Example
Below is the complete code to write pandas dataframe to Excel table.
import pandas as pd
df = pd.DataFrame({
   'Name': ['Namrata','Ravi','Kiran','Karishma'],
   'Percent': [73.33, 70, 75, 65.5],
   'RollNo': [1, 2,3,4]
})

df = df[['RollNo', 'Name', 'Percent']]
(max_row, max_col) = df.shape

writer = pd.ExcelWriter('hello.xlsx', engine='xlsxwriter')
df.to_excel(writer, sheet_name='Sheet1', startrow=1, header=False, index=False)

workbook = writer.book
worksheet = writer.sheets['Sheet1']

column_settings = [{'header': column} for column in df.columns]

worksheet.add_table(0, 0, max_row, max_col - 1, {'columns': column_settings})

writer.save()
Output
The Table using default autofilter settings appears at A1 cell onwards.