- Python XlsxWriter Tutorial
- Python XlsxWriter - Home
- Python XlsxWriter - Overview
- Python XlsxWriter - Environment Setup
- Python XlsxWriter - Hello World
- Python XlsxWriter - Important classes
- Python XlsxWriter - Cell Notation & Ranges
- Python XlsxWriter - Defined Names
- Python XlsxWriter - Formula & Function
- Python XlsxWriter - Date and Time
- Python XlsxWriter - Tables
- Python XlsxWriter - Applying Filter
- Python XlsxWriter - Fonts & Colors
- Python XlsxWriter - Number Formats
- Python XlsxWriter - Border
- Python XlsxWriter - Hyperlinks
- Python XlsxWriter - Conditional Formatting
- Python XlsxWriter - Adding Charts
- Python XlsxWriter - Chart Formatting
- Python XlsxWriter - Chart Legends
- Python XlsxWriter - Bar Chart
- Python XlsxWriter - Line Chart
- Python XlsxWriter - Pie Chart
- Python XlsxWriter - Sparklines
- Python XlsxWriter - Data Validation
- Python XlsxWriter - Outlines & Grouping
- Python XlsxWriter - Freeze & Split Panes
- Python XlsxWriter - Hide/Protect Worksheet
- Python XlsxWriter - Textbox
- Python XlsxWriter - Insert Image
- Python XlsxWriter - Page Setup
- Python XlsxWriter - Header & Footer
- Python XlsxWriter - Cell Comments
- Python XlsxWriter - Working with Pandas
- Python XlsxWriter - VBA Macro
- Python XlsxWriter Useful Resources
- Python XlsxWriter - Quick Guide
- Python XlsxWriter - Useful Resources
- Python XlsxWriter - Discussion
Python XlsxWriter - Sparklines
A sparkline is a small chart, that doesn't have axes or coordinates. It gives a representation of variation of a certain parameter. Normal charts are bigger in size, with a lot of explanatory features such as title, legend, data labels etc. and are set off from the accompanying text. Sparkline on the other hand is small in size and can be embedded inside the text, or a worksheet cell that has its context.
Feature of Sparkline was introduced by Edward Tufte in 1983. Microsoft introduced sparklines in Excel 2010. We can find sparkline option in the insert ribbon of Excel software.
Sparklines are of three types −
line − Similar to line chart
column − Similar to column chart
win_loss − Whether each value is positive (win) or negative (loss).
Working with XlsxWriter Sparklines
XlsxWriter module has add_sparkline() method. It basically needs the cell location of the sparkline and the data range to be represented as a sparkline. Optionally, other parameters such as type, style, etc. are provided in the form of dictionary object. By default, the type is line.
Example
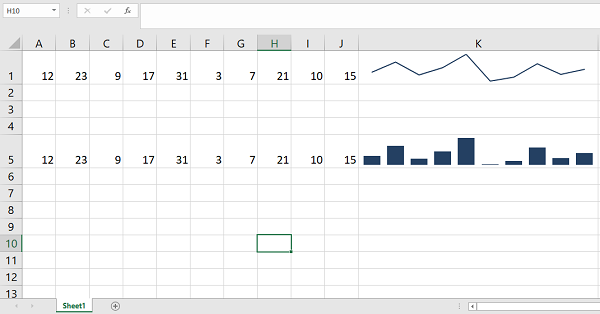
Following program represents same list of numbers in line and column sparklines.
import xlsxwriter

wb = xlsxwriter.Workbook('hello.xlsx')
ws = wb.add_worksheet()

data=[12,23,9,17,31,3,7,21,10,15]

ws.write_row('A1', data)
ws.set_column('K:K', 40)
ws.set_row(0, 30)
ws.add_sparkline('K1', {'range':'Sheet1!A1:J1'})

ws.write_row('A5', data)
ws.set_column('K:K', 40)
ws.set_row(4, 30)
ws.add_sparkline('K5', {'range':'Sheet1!A5:J5', 'type':'column'})

wb.close()
Output
In cell K, the sparklines are added.
The properties are −
range − is the mandatory parameter. It specifies the cell data range that the sparkline will plot.
type − specifies the type of sparkline. There are 3 available sparkline types are line, column and win_loss.
markers − Turn on the markers for line style sparklines
style − The sparkline styles defined in MS Excel. There are 36 style types.
negative_points − If set to True, the negative points in a sparkline are highlighted.
Example
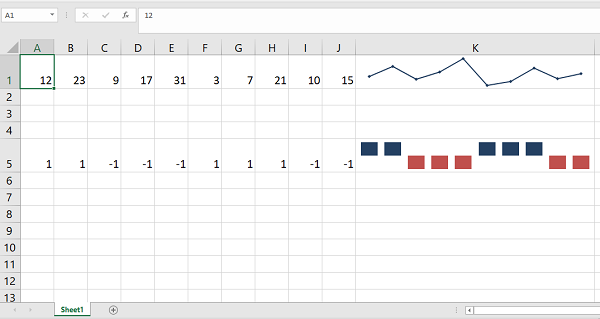
The following program produces a line sparkline with markers and a win_loss sparkline having negative points highlighted.
import xlsxwriter

wb = xlsxwriter.Workbook('hello.xlsx')
ws = wb.add_worksheet()

data=[12,23,9,17,31,3,7,21,10,15]
ws.write_row('A1', data)
ws.set_column('K:K', 40)
ws.set_row(0, 30)

data=[1,1,-1,-1,-1,1,1,1,-1,-1]
ws.write_row('A5', data)
ws.set_column('K:K', 40)
ws.set_row(4, 30)
ws.add_sparkline('K1', {'range':'Sheet1!A1:J1', 'markers':True})
ws.add_sparkline('K5', {'range':'Sheet1!A5:J5', 'type':'win_loss',
'negative_points':True})

wb.close()
Output
Line Sparkline in K1 has markers. The sparkline in K5 shows negative points highlighting.
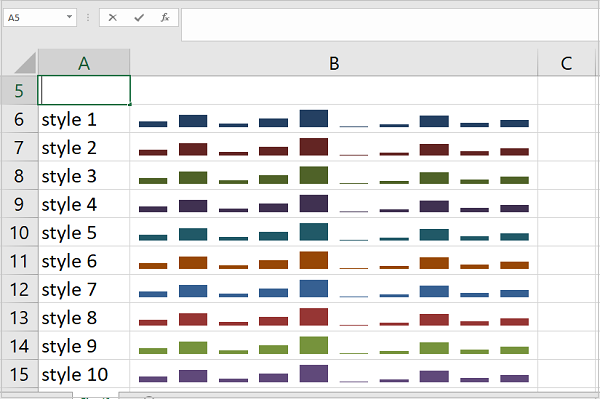
Example – Style Types
Following code displays a series of numbers in column sparkline. Ten different style types are used here.
import xlsxwriter

wb = xlsxwriter.Workbook('hello.xlsx')
ws = wb.add_worksheet()

data=[12,23,9,17,31,3,7,21,10,15]
ws.write_row('C3', data)
ws.set_column('B:B',40)

for i in range(1,11):
   ws.write(i+4,0, 'style {}'.format(i))
   ws.add_sparkline(i+4,1,
   {'range':'Sheet1!$C$3:$L$3',
   'type':'column',
   'style':i})

wb.close()
Output
It will produce the following output −