- PySimpleGUI Tutorial
- PySimpleGUI - Home
- PySimpleGUI - Introduction
- PySimpleGUI - Environment Setup
- PySimpleGUI - Hello World
- PySimpleGUI - Popup Windows
- PySimpleGUI - Window Class
- PySimpleGUI - Element Class
- PySimpleGUI - Events
- PySimpleGUI - Menubar
- PySimpleGUI - Matplotlib Integration
- PySimpleGUI - Working with PIL
- PySimpleGUI - Debugger
- PySimpleGUI - Settings
- PySimpleGUI Useful Resources
- PySimpleGUI - Quick Guide
- PySimpleGUI - Useful Resources
- PySimpleGUI - Discussion
PySimpleGUI - Matplotlib Integration
When Matplotlib is used from Python shell, the plots are displayed in a default window. The backend_tkagg module is useful for embedding plots in Tkinter.
The Canvas element in PySimpleGUI has TKCanvas method that returns original TKinter's Canvas object. It is given to the FigureCanvasTkAgg() function in the backend_tkagg module to draw the figure.
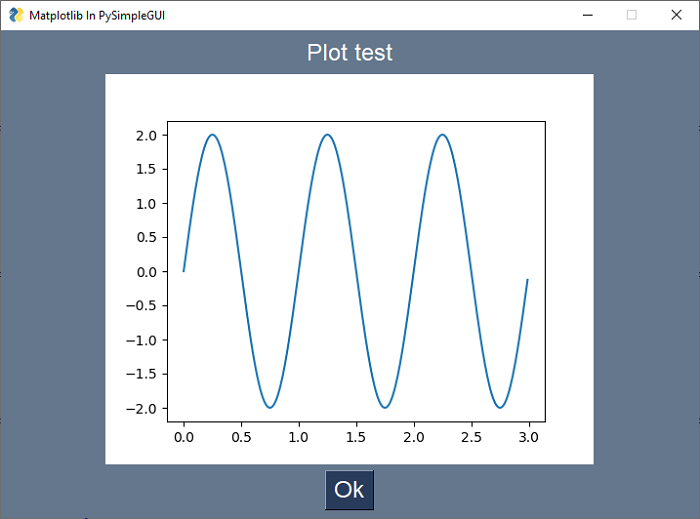
First, we need to create the figure object using the Figure() class and a plot to it. We shall draw a simple plot showing sine wave.
fig = matplotlib.figure.Figure(figsize=(5, 4), dpi=100)
t = np.arange(0, 3, .01)
fig.add_subplot(111).plot(t, 2 * np.sin(2 * np.pi * t))
Define a function to draw the matplotlib figure object on the canvas
def draw_figure(canvas, figure):
   figure_canvas_agg = FigureCanvasTkAgg(figure, canvas)
   figure_canvas_agg.draw()
   figure_canvas_agg.get_tk_widget().pack(side='top', fill='both', expand=1)
   return figure_canvas_agg
Obtain the Canvas from PySimpleGUI.Canvas object by calling its TkCanvas property.
layout = [
   [psg.Text('Plot test')],
   [psg.Canvas(key='-CANVAS-')],
   [psg.Button('Ok')]
]
Draw the figure by calling the above function. Pass the Canvas object and fifure object to it.
fig_canvas_agg = draw_figure(window['-CANVAS-'].TKCanvas, fig)
Example: Draw a Sinewave Line graph
The complete code is given below −
import matplotlib.pyplot as plt
import numpy as np
from matplotlib.backends.backend_tkagg import
FigureCanvasTkAgg
import PySimpleGUI as sg
import matplotlib
matplotlib.use('TkAgg')
fig = matplotlib.figure.Figure(figsize=(5, 4), dpi=100)
t = np.arange(0, 3, .01)
fig.add_subplot(111).plot(t, 2 * np.sin(2 * np.pi * t))
def draw_figure(canvas, figure):
   tkcanvas = FigureCanvasTkAgg(figure, canvas)
   tkcanvas.draw()
   tkcanvas.get_tk_widget().pack(side='top', fill='both', expand=1)
   return tkcanvas
layout = [[sg.Text('Plot test')],
   [sg.Canvas(key='-CANVAS-')],
   [sg.Button('Ok')]]
window = sg.Window('Matplotlib In PySimpleGUI', layout, size=(715, 500), finalize=True, element_justification='center', font='Helvetica 18')

# add the plot to the window
tkcanvas = draw_figure(window['-CANVAS-'].TKCanvas, fig)
event, values = window.read()
window.close()
The generated graph is as follows −