- Plotly Tutorial
- Plotly - Home
- Plotly - Introduction
- Plotly - Environment Setup
- Plotly - Online & Offline Plotting
- Plotting Inline with Jupyter Notebook
- Plotly - Package Structure
- Plotly - Exporting to Static Images
- Plotly - Legends
- Plotly - Format Axis & Ticks
- Plotly - Subplots & Inset Plots
- Plotly - Bar Chart & Pie Chart
- Plotly - Scatter Plot, Scattergl Plot & Bubble Charts
- Plotly - Dot Plots & Table
- Plotly - Histogram
- Plotly - Box Plot Violin Plot & Contour Plot
- Plotly - Distplots, Density Plot & Error Bar Plot
- Plotly - Heatmap
- Plotly - Polar Chart & Radar Chart
- Plotly - OHLC Chart Waterfall Chart & Funnel Chart
- Plotly - 3D Scatter & Surface Plot
- Plotly - Adding Buttons/Dropdown
- Plotly - Slider Control
- Plotly - FigureWidget Class
- Plotly with Pandas and Cufflinks
- Plotly with Matplotlib and Chart Studio
- Plotly Useful Resources
- Plotly - Quick Guide
- Plotly - Useful Resources
- Plotly - Discussion
Plotly with Pandas and Cufflinks
Pandas is a very popular library in Python for data analysis. It also has its own plot function support. However, Pandas plots don't provide interactivity in visualization. Thankfully, plotly's interactive and dynamic plots can be built using Pandas dataframe objects.
We start by building a Dataframe from simple list objects.
data = [['Ravi',21,67],['Kiran',24,61],['Anita',18,46],['Smita',20,78],['Sunil',17,90]]
df = pd.DataFrame(data,columns = ['name','age','marks'],dtype = float)
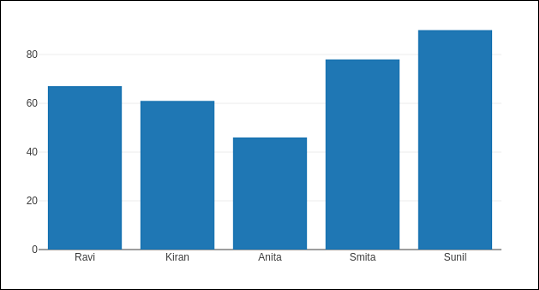
The dataframe columns are used as data values for x and y properties of graph object traces. Here, we will generate a bar trace using name and marks columns.
trace = go.Bar(x = df.name, y = df.marks)
fig = go.Figure(data = [trace])
iplot(fig)
A simple bar plot will be displayed in Jupyter notebook as below −
Plotly is built on top of d3.js and is specifically a charting library which can be used directly with Pandas dataframes using another library named Cufflinks.
If not already available, install cufflinks package by using your favourite package manager like pip as given below −
pip install cufflinks
or
conda install -c conda-forge cufflinks-py
First, import cufflinks along with other libraries such as Pandas and numpy which can configure it for offline use.
import cufflinks as cf
cf.go_offline()
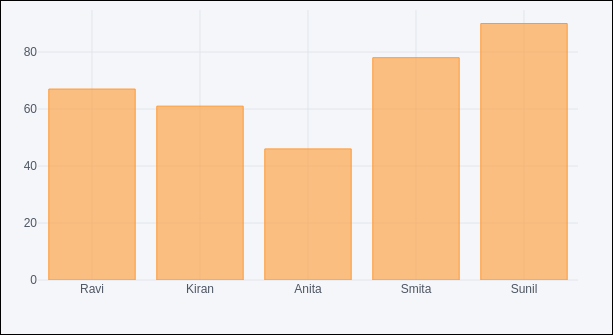
Now, you can directly use Pandas dataframe to display various kinds of plots without having to use trace and figure objects from graph_objs module as we have been doing previously.
df.iplot(kind = 'bar', x = 'name', y = 'marks')
Bar plot, very similar to earlier one will be displayed as given below −
Pandas dataframes from databases
Instead of using Python lists for constructing dataframe, it can be populated by data in different types of databases. For example, data from a CSV file, SQLite database table or mysql database table can be fetched into a Pandas dataframe, which eventually is subjected to plotly graphs using Figure object or Cufflinks interface.
To fetch data from CSV file, we can use read_csv() function from Pandas library.
import pandas as pd
df = pd.read_csv('sample-data.csv')
If data is available in SQLite database table, it can be retrieved using SQLAlchemy library as follows −
import pandas as pd
from sqlalchemy import create_engine
disk_engine = create_engine('sqlite:///mydb.db')
df = pd.read_sql_query('SELECT name,age,marks', disk_engine)
On the other hand, data from MySQL database is retrieved in a Pandas dataframe as follows −
import pymysql
import pandas as pd
conn = pymysql.connect(host = "localhost", user = "root", passwd = "xxxx", db = "mydb")
cursor = conn.cursor()
cursor.execute('select name,age,marks')
rows = cursor.fetchall()
df = pd.DataFrame( [[ij for ij in i] for i in rows] )
df.rename(columns = {0: 'Name', 1: 'age', 2: 'marks'}, inplace = True)