- Plotly Tutorial
- Plotly - Home
- Plotly - Introduction
- Plotly - Environment Setup
- Plotly - Online & Offline Plotting
- Plotting Inline with Jupyter Notebook
- Plotly - Package Structure
- Plotly - Exporting to Static Images
- Plotly - Legends
- Plotly - Format Axis & Ticks
- Plotly - Subplots & Inset Plots
- Plotly - Bar Chart & Pie Chart
- Plotly - Scatter Plot, Scattergl Plot & Bubble Charts
- Plotly - Dot Plots & Table
- Plotly - Histogram
- Plotly - Box Plot Violin Plot & Contour Plot
- Plotly - Distplots, Density Plot & Error Bar Plot
- Plotly - Heatmap
- Plotly - Polar Chart & Radar Chart
- Plotly - OHLC Chart Waterfall Chart & Funnel Chart
- Plotly - 3D Scatter & Surface Plot
- Plotly - Adding Buttons/Dropdown
- Plotly - Slider Control
- Plotly - FigureWidget Class
- Plotly with Pandas and Cufflinks
- Plotly with Matplotlib and Chart Studio
- Plotly Useful Resources
- Plotly - Quick Guide
- Plotly - Useful Resources
- Plotly - Discussion
Plotly - Plotting Inline with Jupyter Notebook
In this chapter, we will study how to do inline plotting with the Jupyter Notebook.
In order to display the plot inside the notebook, you need to initiate plotly’s notebook mode as follows −
from plotly.offline import init_notebook_mode
init_notebook_mode(connected = True)
Keep rest of the script as it is and run the notebook cell by pressing Shift+Enter. Graph will be displayed offline inside the notebook itself.
import plotly
plotly.tools.set_credentials_file(username = 'lathkar', api_key = '************')
from plotly.offline import iplot, init_notebook_mode
init_notebook_mode(connected = True)

import plotly
import plotly.graph_objs as go
import numpy as np
import math #needed for definition of pi

xpoints = np.arange(0, math.pi*2, 0.05)
ypoints = np.sin(xpoints)
trace0 = go.Scatter(
   x = xpoints, y = ypoints
)
data = [trace0]
plotly.offline.iplot({ "data": data,"layout": go.Layout(title="Sine wave")})
Jupyter notebook output will be as shown below −
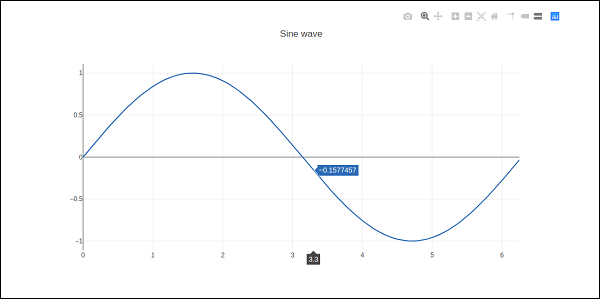
The plot output shows a tool bar at top right. It contains buttons for download as png, zoom in and out, box and lasso, select and hover.

Advertisements