- Pentaho Tutorial
- Pentaho - Home
- Pentaho - Overview
- Pentaho - Installation
- Pentaho - Navigation
- Pentaho - Data Sources & Queries
- Pentaho - Reporting Elements
- Pentaho - Page Footer Fields
- Pentaho - Groups
- Pentaho - Chart Report
- Formatting Report Elements
- Pentaho - Functions
- Pentaho Useful Resources
- Pentaho - Quick Guide
- Pentaho - Useful Resources
- Pentaho - Discussion
Pentaho - Navigation
This chapter will provide a brief introduction on the user interfaces available in Pentaho and how to navigate through them.
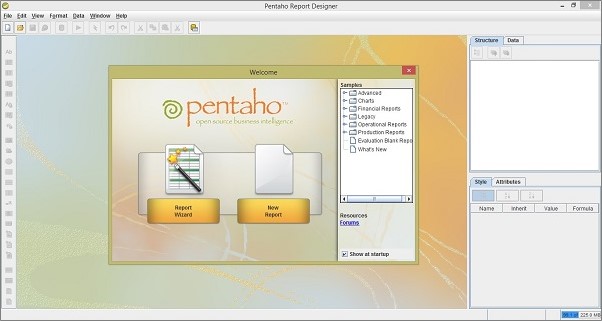
The Welcome Screen
The welcome screen provides two ways to create reports of different types. Those two options are Report Wizard and New Report.
Report Wizard − It provides an easy-to-use four steps process that walk you through creating a new Report.
New Report − If you choose this option, then you can create customized reports based on your requirement.
Pentaho has a set of sample reports to help you figure out how to use a certain Report Designer. The following screenshot shows the welcome page of Pentaho.
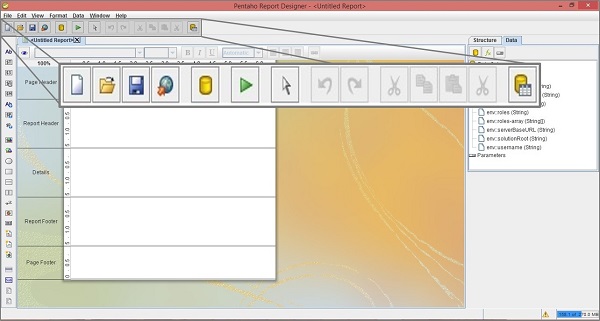
The Main Toolbar
The main toolbar is at the top of the window. Take a look at the following screenshot – the maximized box is the main tollbar. It contains button to carry out the following actions − New File, Open File, Save File, Publish the Report, Add Data Source, Run the Report, Select Object, Undo, Redo, Cut Element, Copy Element, Paste Element, Delete Selected Element, and Toggle the Field-Selector Palette.
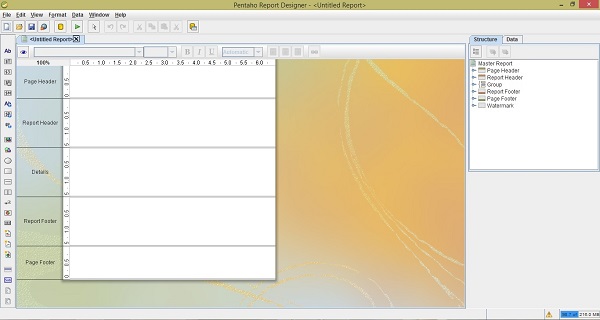
The Report Workspace
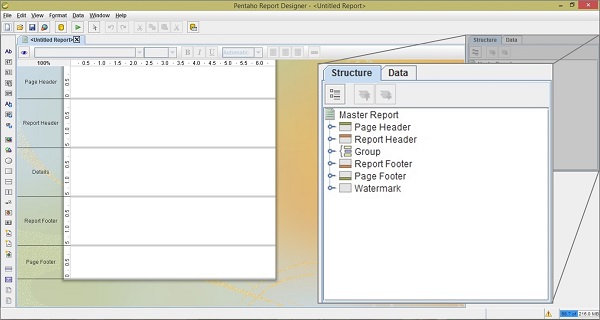
The workspace is the main working area where we can design the reports. Take a look at the following screenshot – the white area at the center is the workspace. It is divided into five bands − Page Header, Report Header, Details, Report Footer, and Page Footer.
Page Header − You can use any type of data here that is suitable to print on top of every report page. It does not allow any dynamic values or page breaks.
Report Header − The second band from top is the Report Header. It contains the report elements. It appears once per report, that is on the first page of the report.
Details − The Details band is the largest portion of your page because most of the report data is presented in this area.
Report Footer − Just like the Report Header, the Report Footer appears just once per report, that is on the last page of the report.
Page Footer − The last band is the Page Footer which appears at the absolute bottom of every page in the report.
You can also create groups for various report elements. Each group has its own Header and Footer bands in the workspace.
The Structure Pane
The structure tab shares a pane with the Data tab in the upper right section of the Report Designer. Take a look at the following screenshot; it shows the exact hierarchy of every element included in a report workspace.
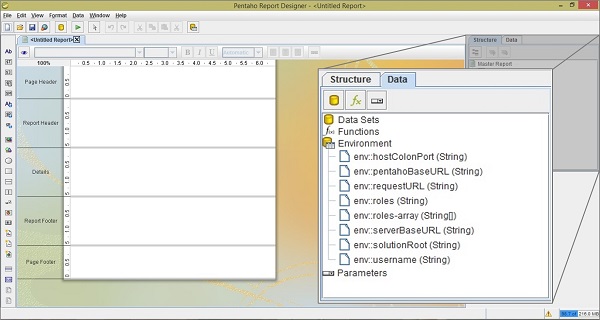
The Data Pane
The Data Pane enables you to add data sources and view individual queries, functions, and parameters in each report. The three buttons at the top of the pane are meant for adding new data sources, functions, and parameters, respectively.
Datasources − All the data sources and queries that you have defined for the current report will be listed here. If you want to add a new data source, then rightclick on the leftmost button (the yello cylinder) click add.
Functions − All the functions (mathematical and conditional) elements that you added to a report will be listed in this category. You can add a function by clicking the (fx) button.
Parameters − You can add a parameter to your report, which will enable the report readers to customize the content of the output.
Take a look at the following screenshot.
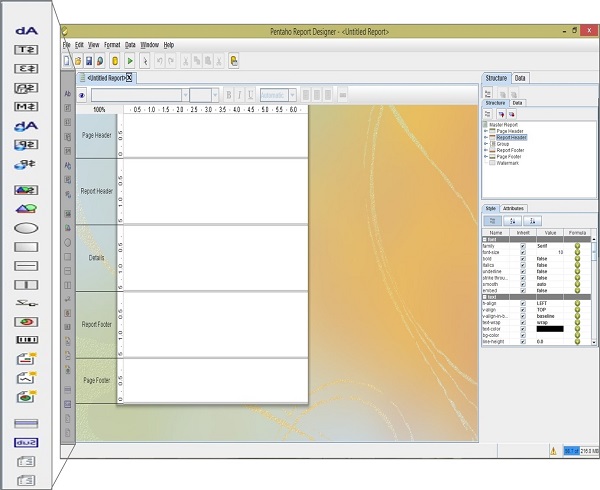
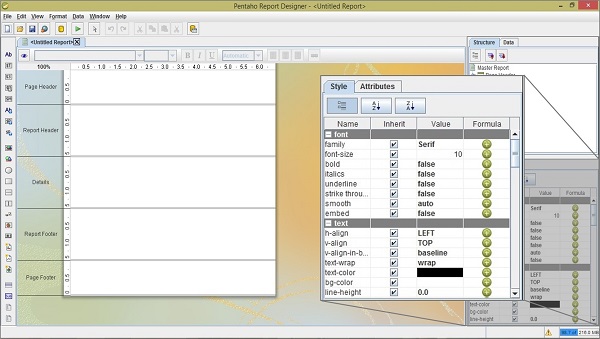
The Style Pane
The style pane displays all the visual and positional style options for any given item in the structure pane. Click any structure element, and the composition of the Style Pane will be adjusted to show all the available style properties listed by group. Take a look at the following screenshot.
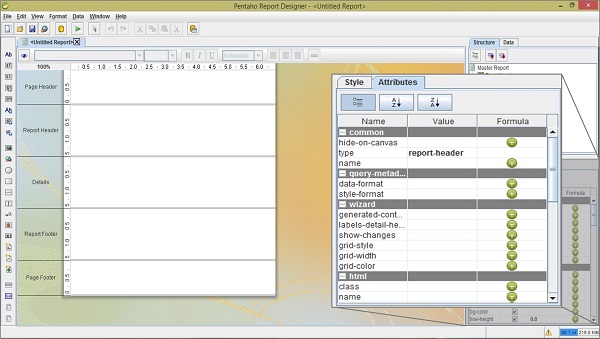
The Attribute Pane
The Attribute Pane displays all the low-level properties, and input and output options for any given item in the Structure Pane.
The Palette
The palette contains all the elements that you can use to build a report. To add an element, click on a layout band to select it, then drag and drop an element from the palette to the selected band. We have explained the role of each of the report elements in the following table.
| Element icon | Element name | Description |
|---|---|---|
 |
Label | A static text string. It cannot change dynamically. |
 |
Text-Field | A Textual report element and changed dynamically based on the query. |
 |
Number-Field | Displays dynamic numerical data from a query. |
 |
Date-Field | Handles date information form a query. |
 |
Message | An element that combines multiple static and dynamic report elements. |
 |
Resource-label | Static text string that maps to a resource bundle |
 |
Resource-Field | Dynamic text string that maps to a resource bundle, allowing you to localize any database field. |
 |
Resource - Message | Dynamic text string that concatenates data from multiple types, and dynamically maps to a resource bundle. |
 |
Image-Field | A reference to an image stored in a database. |
 |
Image | A static image embedded into a report. |
 |
Ellipse | A vector graphical element in the shape of eclipse. |
 |
Rectangle | A vector graphical element in the shape of rectangle. |
 |
Horizontal-Line | A vector graphical line, drawn horizontally. |
 |
Vertical-Line | A vector graphical line, drawn vertically. |
 |
Survey-Scale | A simple sliding scale chart element. |
 |
Chart | A chart or graph that shows your query results graphically. |
 |
Simple-Barcodes | A barcode chart element. |
 |
Bar-Sparkline | A Bar Sparkline chart element. |
 |
Line-Sparkline | A line Sparkline chart element. |
 |
Pie-Sparkline | A Pie Sparkline chart element. |
 |
Band | A method of grouping elements. |
 |
Sub-Report | An element that references another report. |
 |
Table-Of-Content | A table of content report element. |
 |
Index | An Index report element. |
Take a look at the following screenshot; the highlighted box on the left side is the palette of reporting elements.