- OOAD Tutorial
- OOAD - Home
- OOAD - Object Oriented Paradigm
- OOAD - Object Oriented Model
- OOAD - Object Oriented System
- OOAD - Object Oriented Principles
- OOAD - Object Oriented Analysis
- OOAD - Dynamic Modelling
- OOAD - Functional Modelling
- OOAD - UML Analysis Model
- OOAD - UML Basic Notations
- OOAD - UML Structural Diagrams
- OOAD - UML Behavioural Diagrams
- OOAD - Object Oriented Design
- OOAD - Implementation Strategies
- OOAD - Testing & Quality Assurance
- OOAD Useful Resources
- OOAD - Quick Guide
- OOAD - Useful Resources
OOAD - Functional Modeling
Functional Modelling gives the process perspective of the object-oriented analysis model and an overview of what the system is supposed to do. It defines the function of the internal processes in the system with the aid of Data Flow Diagrams (DFDs). It depicts the functional derivation of the data values without indicating how they are derived when they are computed, or why they need to be computed.
Data Flow Diagrams
Functional Modelling is represented through a hierarchy of DFDs. The DFD is a graphical representation of a system that shows the inputs to the system, the processing upon the inputs, the outputs of the system as well as the internal data stores. DFDs illustrate the series of transformations or computations performed on the objects or the system, and the external controls and objects that affect the transformation.
Rumbaugh et al. have defined DFD as, “A data flow diagram is a graph which shows the flow of data values from their sources in objects through processes that transform them to their destinations on other objects.”
The four main parts of a DFD are −
- Processes,
- Data Flows,
- Actors, and
- Data Stores.
The other parts of a DFD are −
- Constraints, and
- Control Flows.
Features of a DFD
Processes
Processes are the computational activities that transform data values. A whole system can be visualized as a high-level process. A process may be further divided into smaller components. The lowest-level process may be a simple function.
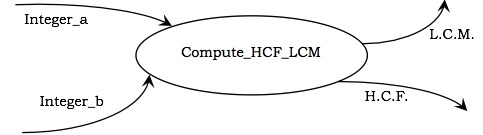
Representation in DFD − A process is represented as an ellipse with its name written inside it and contains a fixed number of input and output data values.
Example − The following figure shows a process Compute_HCF_LCM that accepts two integers as inputs and outputs their HCF (highest common factor) and LCM (least common multiple).
Data Flows
Data flow represents the flow of data between two processes. It could be between an actor and a process, or between a data store and a process. A data flow denotes the value of a data item at some point of the computation. This value is not changed by the data flow.
Representation in DFD − A data flow is represented by a directed arc or an arrow, labelled with the name of the data item that it carries.
In the above figure, Integer_a and Integer_b represent the input data flows to the process, while L.C.M. and H.C.F. are the output data flows.
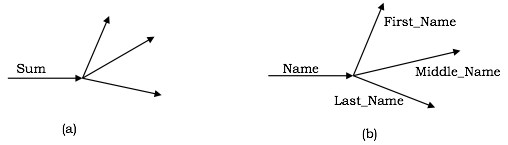
A data flow may be forked in the following cases −
The output value is sent to several places as shown in the following figure. Here, the output arrows are unlabelled as they denote the same value.
The data flow contains an aggregate value, and each of the components is sent to different places as shown in the following figure. Here, each of the forked components is labelled.
Actors
Actors are the active objects that interact with the system by either producing data and inputting them to the system, or consuming data produced by the system. In other words, actors serve as the sources and the sinks of data.
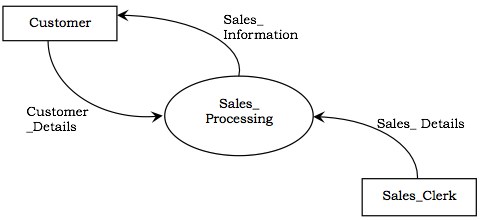
Representation in DFD − An actor is represented by a rectangle. Actors are connected to the inputs and outputs and lie on the boundary of the DFD.
Example − The following figure shows the actors, namely, Customer and Sales_Clerk in a counter sales system.
Data Stores
Data stores are the passive objects that act as a repository of data. Unlike actors, they cannot perform any operations. They are used to store data and retrieve the stored data. They represent a data structure, a disk file, or a table in a database.
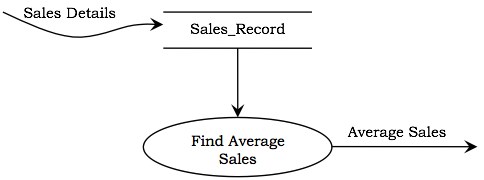
Representation in DFD − A data store is represented by two parallel lines containing the name of the data store. Each data store is connected to at least one process. Input arrows contain information to modify the contents of the data store, while output arrows contain information retrieved from the data store. When a part of the information is to be retrieved, the output arrow is labelled. An unlabelled arrow denotes full data retrieval. A two-way arrow implies both retrieval and update.
Example − The following figure shows a data store, Sales_Record, that stores the details of all sales. Input to the data store comprises of details of sales such as item, billing amount, date, etc. To find the average sales, the process retrieves the sales records and computes the average.
Constraints
Constraints specify the conditions or restrictions that need to be satisfied over time. They allow adding new rules or modifying existing ones. Constraints can appear in all the three models of object-oriented analysis.
In Object Modelling, the constraints define the relationship between objects. They may also define the relationship between the different values that an object may take at different times.
In Dynamic Modelling, the constraints define the relationship between the states and events of different objects.
In Functional Modelling, the constraints define the restrictions on the transformations and computations.
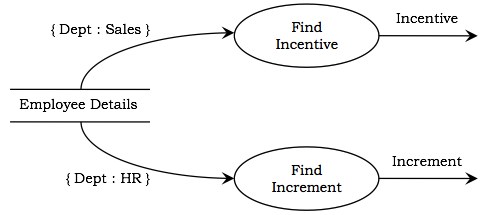
Representation − A constraint is rendered as a string within braces.
Example − The following figure shows a portion of DFD for computing the salary of employees of a company that has decided to give incentives to all employees of the sales department and increment the salary of all employees of the HR department. It can be seen that the constraint {Dept:Sales} causes incentive to be calculated only if the department is sales and the constraint {Dept:HR} causes increment to be computed only if the department is HR.
Control Flows
A process may be associated with a certain Boolean value and is evaluated only if the value is true, though it is not a direct input to the process. These Boolean values are called the control flows.
Representation in DFD − Control flows are represented by a dotted arc from the process producing the Boolean value to the process controlled by them.
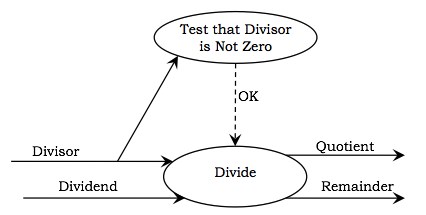
Example − The following figure represents a DFD for arithmetic division. The Divisor is tested for non-zero. If it is not zero, the control flow OK has a value True and subsequently the Divide process computes the Quotient and the Remainder.
Developing the DFD Model of a System
In order to develop the DFD model of a system, a hierarchy of DFDs are constructed. The top-level DFD comprises of a single process and the actors interacting with it.
At each successive lower level, further details are gradually included. A process is decomposed into sub-processes, the data flows among the sub-processes are identified, the control flows are determined, and the data stores are defined. While decomposing a process, the data flow into or out of the process should match the data flow at the next level of DFD.
Example − Let us consider a software system, Wholesaler Software, that automates the transactions of a wholesale shop. The shop sells in bulks and has a clientele comprising of merchants and retail shop owners. Each customer is asked to register with his/her particulars and is given a unique customer code, C_Code. Once a sale is done, the shop registers its details and sends the goods for dispatch. Each year, the shop distributes Christmas gifts to its customers, which comprise of a silver coin or a gold coin depending upon the total sales and the decision of the proprietor.
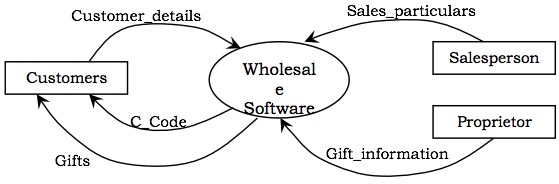
The functional model for the Wholesale Software is given below. The figure below shows the top-level DFD. It shows the software as a single process and the actors that interact with it.
The actors in the system are −
- Customers
- Salesperson
- Proprietor
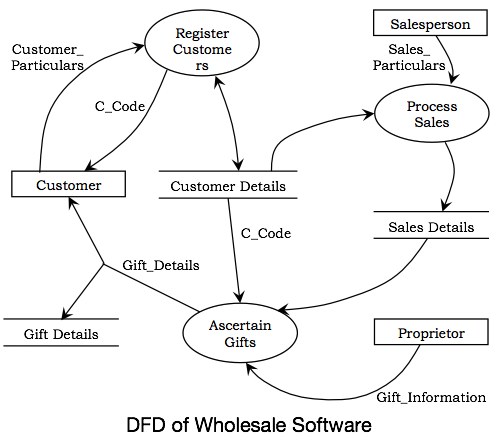
In the next level DFD, as shown in the following figure, the major processes of the system are identified, the data stores are defined and the interaction of the processes with the actors, and the data stores are established.
In the system, three processes can be identified, which are −
- Register Customers
- Process Sales
- Ascertain Gifts
The data stores that will be required are −
- Customer Details
- Sales Details
- Gift Details
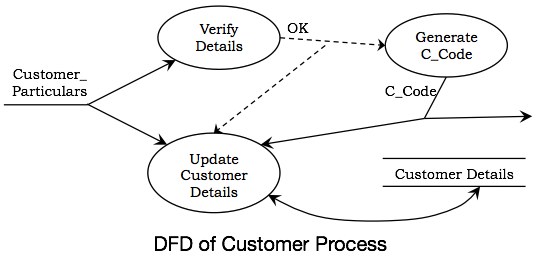
The following figure shows the details of the process Register Customer. There are three processes in it, Verify Details, Generate C_Code, and Update Customer Details. When the details of the customer are entered, they are verified. If the data is correct, C_Code is generated and the data store Customer Details is updated.
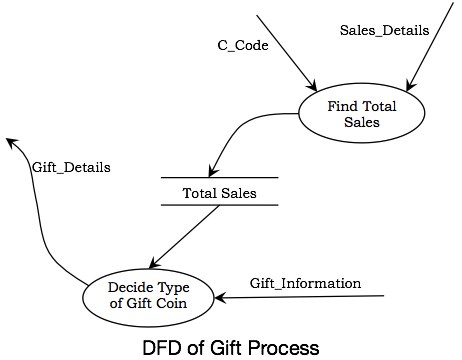
The following figure shows the expansion of the process Ascertain Gifts. It has two processes in it, Find Total Sales and Decide Type of Gift Coin. The Find Total Sales process computes the yearly total sales corresponding to each customer and records the data. Taking this record and the decision of the proprietor as inputs, the gift coins are allotted through Decide Type of Gift Coin process.
Advantages and Disadvantages of DFD
| Advantages | Disadvantages |
|---|---|
| DFDs depict the boundaries of a system and hence are helpful in portraying the relationship between the external objects and the processes within the system. | DFDs take a long time to create, which may not be feasible for practical purposes. |
| They help the users to have a knowledge about the system. | DFDs do not provide any information about the time-dependent behavior, i.e., they do not specify when the transformations are done. |
| The graphical representation serves as a blueprint for the programmers to develop a system. | They do not throw any light on the frequency of computations or the reasons for computations. |
| DFDs provide detailed information about the system processes. | The preparation of DFDs is a complex process that needs considerable expertise. Also, it is difficult for a non-technical person to understand. |
| They are used as a part of the system documentation. | The method of preparation is subjective and leaves ample scope to be imprecise. |
Relationship between Object, Dynamic, and Functional Models
The Object Model, the Dynamic Model, and the Functional Model are complementary to each other for a complete Object-Oriented Analysis.
Object modelling develops the static structure of the software system in terms of objects. Thus it shows the “doers” of a system.
Dynamic Modelling develops the temporal behavior of the objects in response to external events. It shows the sequences of operations performed on the objects.
Functional model gives an overview of what the system should do.
Functional Model and Object Model
The four main parts of a Functional Model in terms of object model are −
Process − Processes imply the methods of the objects that need to be implemented.
Actors − Actors are the objects in the object model.
Data Stores − These are either objects in the object model or attributes of objects.
Data Flows − Data flows to or from actors represent operations on or by objects. Data flows to or from data stores represent queries or updates.
Functional Model and Dynamic Model
The dynamic model states when the operations are performed, while the functional model states how they are performed and which arguments are needed. As actors are active objects, the dynamic model has to specify when it acts. The data stores are passive objects and they only respond to updates and queries; therefore the dynamic model need not specify when they act.
Object Model and Dynamic Model
The dynamic model shows the status of the objects and the operations performed on the occurrences of events and the subsequent changes in states. The state of the object as a result of the changes is shown in the object model.