- Microwave Engineering Tutorial
- Microwave Engineering - Home
- Introduction
- Transmission Lines
- Modes of Propagation
- Types of Transmission Lines
- Waveguides
- Components
- Avalanche Transit Time Devices
- Microwave Devices
- E-Plane Tee
- H-Plane Tee
- E-H Plane Tee
- Rat-race Junction
- Directional Couplers
- Cavity Klystron
- Reflex Klystron
- Travelling Wave Tube
- Magnetrons
- Measurement Devices
- Measurements
- Example Problems
- Microwave Engineering Resources
- Quick Guide
- Microwave Engineering - Resources
- Microwave Engineering - Discussion
Microwave Engineering - Measurements
In the field of Microwave engineering, there occurs many applications, as already stated in first chapter. Hence, while using different applications, we often come across the need of measuring different values such as Power, Attenuation, Phase shift, VSWR, Impedance, etc. for the effective usage.
In this chapter, let us take a look at the different measurement techniques.
Measurement of Power
The Microwave Power measured is the average power at any position in waveguide. Power measurement can be of three types.
-
Measurement of Low power (0.01mW to 10mW)
Example − Bolometric technique
-
Measurement of Medium power (10mW to 1W)
Example − Calorimeter technique
-
Measurement of High power (>10W)
Example − Calorimeter Watt meter
Let us go through them in detail.
Measurement of Low Power
The measurement of Microwave power around 0.01mW to 10mW, can be understood as the measurement of low power.
Bolometer is a device which is used for low Microwave power measurements. The element used in bolometer could be of positive or negative temperature coefficient. For example, a barrater has a positive temperature coefficient whose resistance increases with the increase in temperature. Thermistor has negative temperature coefficient whose resistance decreases with the increase in temperature.
Any of them can be used in the bolometer, but the change in resistance is proportional to Microwave power applied for measurement. This bolometer is used in a bridge of the arms as one so that any imbalance caused, affects the output. A typical example of a bridge circuit using a bolometer is as shown in the following figure.
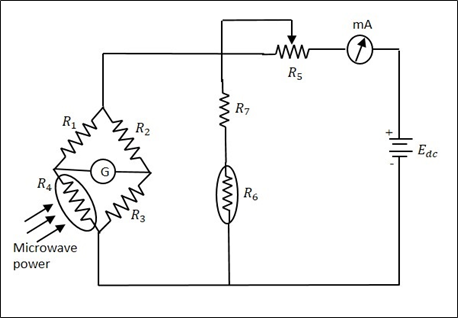
The milliammeter here, gives the value of the current flowing. The battery is variable, which is varied to obtain balance, when an imbalance is caused by the behavior of the bolometer. This adjustment which is made in DC battery voltage is proportional to the Microwave power. The power handling capacity of this circuit is limited.
Measurement of Medium Power
The measurement of Microwave power around 10mW to 1W, can be understood as the measurement of medium power.
A special load is employed, which usually maintains a certain value of specific heat. The power to be measured, is applied at its input which proportionally changes the output temperature of the load that it already maintains. The difference in temperature rise, specifies the input Microwave power to the load.
The bridge balance technique is used here to get the output. The heat transfer method is used for the measurement of power, which is a Calorimetric technique.
Measurement of High Power
The measurement of Microwave power around 10W to 50KW, can be understood as the measurement of high power.
The High Microwave power is normally measured by Calorimetric watt meters, which can be of dry and flow type. The dry type is named so as it uses a coaxial cable which is filled with di-electric of high hysteresis loss, whereas the flow type is named so as it uses water or oil or some liquid which is a good absorber of microwaves.
The change in temperature of the liquid before and after entering the load, is taken for the calibration of values. The limitations in this method are like flow determination, calibration and thermal inertia, etc.
Measurement of Attenuation
In practice, Microwave components and devices often provide some attenuation. The amount of attenuation offered can be measured in two ways. They are − Power ratio method and RF substitution method.
Attenuation is the ratio of input power to the output power and is normally expressed in decibels.
$$Attenuation \: in \: dBs = 10 \: log\frac{P_{in}}{P_{out}}$$
Where $P_{in}$ = Input power and $P_{out}$ = Output power
Power Ratio Method
In this method, the measurement of attenuation takes place in two steps.
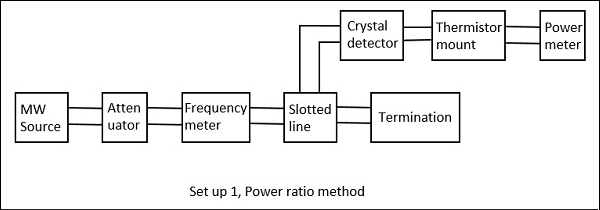
Step 1 − The input and output power of the whole Microwave bench is done without the device whose attenuation has to be calculated.
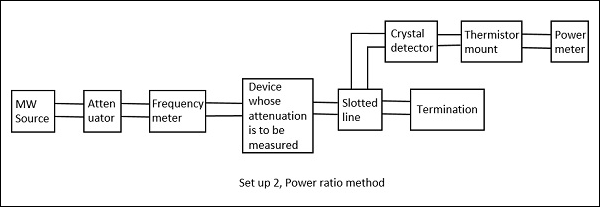
Step 2 − The input and output power of the whole Microwave bench is done with the device whose attenuation has to be calculated.
The ratio of these powers when compared, gives the value of attenuation.
The following figures are the two setups which explain this.
Drawback − The power and the attenuation measurements may not be accurate, when the input power is low and attenuation of the network is large.
RF Substitution Method
In this method, the measurement of attenuation takes place in three steps.
Step 1 − The output power of the whole Microwave bench is measured with the network whose attenuation has to be calculated.
Step 2 − The output power of the whole Microwave bench is measured by replacing the network with a precision calibrated attenuator.
Step 3 − Now, this attenuator is adjusted to obtain the same power as measured with the network.
The following figures are the two setups which explain this.
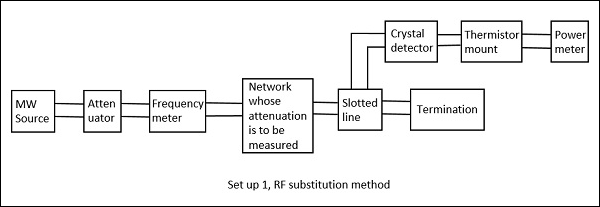
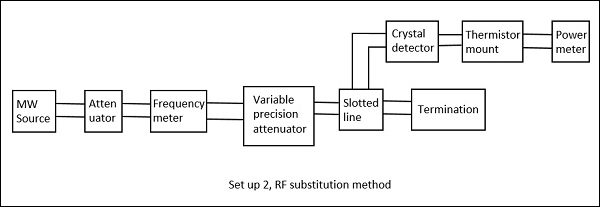
The adjusted value on the attenuator gives the attenuation of the network directly. The drawback in the above method is avoided here and hence this is a better procedure to measure the attenuation.
Measurement of Phase Shift
In practical working conditions, there might occur a phase change in the signal from the actual signal. To measure such phase shift, we use a comparison technique, by which we can calibrate the phase shift.
The setup to calculate the phase shift is shown in the following figure.
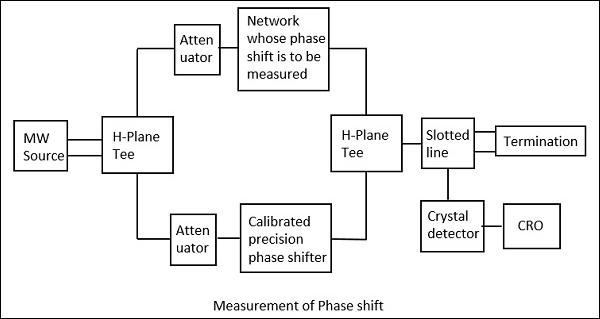
Here, after the microwave source generates the signal, it is passed through an H-plane Tee junction from which one port is connected to the network whose phase shift is to be measured and the other port is connected to an adjustable precision phase shifter.
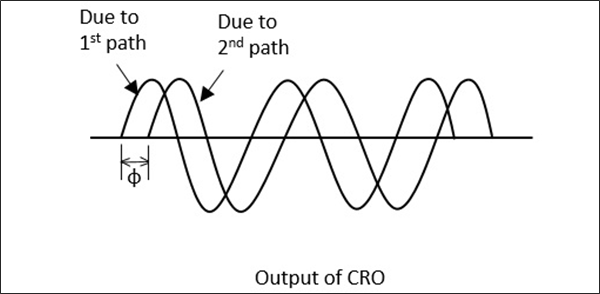
The demodulated output is a 1 KHz sine wave, which is observed in the CRO connected. This phase shifter is adjusted such that its output of 1 KHz sine wave also matches the above. After the matching is done by observing in the dual mode CRO, this precision phase shifter gives us the reading of phase shift. This is clearly understood by the following figure.
This procedure is the mostly used one in the measurement of phase shift. Now, let us see how to calculate the VSWR.
Measurement of VSWR
In any Microwave practical applications, any kind of impedance mismatches lead to the formation of standing waves. The strength of these standing waves is measured by Voltage Standing Wave Ratio ($VSWR$). The ratio of maximum to minimum voltage gives the $VSWR$, which is denoted by $S$.
$$S = \frac{V_{max}}{V_{min}} = \frac{1+\rho }{1-\rho}$$
Where, $\rho = reflection \: co - efficient = \frac{P_{reflected}}{P_{incident}}$
The measurement of $VSWR$ can be done in two ways, Low $VSWR$ and High $VSWR$ measurements.
Measurement of Low VSWR (S <10)
The measurement of low $VSWR$ can be done by adjusting the attenuator to get a reading on a DC millivoltmeter which is VSWR meter. The readings can be taken by adjusting the slotted line and the attenuator in such a way that the DC millivoltmeter shows a full scale reading as well as a minimum reading.
Now these two readings are calculated to find out the $VSWR$ of the network.
Measurement of High VSWR (S>10)
The measurement of high $VSWR$ whose value is greater than 10 can be measured by a method called the double minimum method. In this method, the reading at the minimum value is taken, and the readings at the half point of minimum value in the crest before and the crest after are also taken. This can be understood by the following figure.
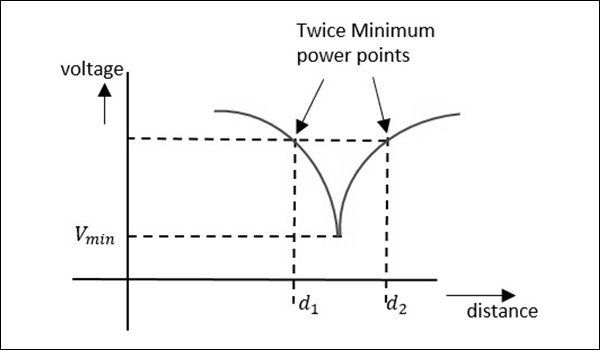
Now, the $VSWR$ can be calculated by a relation, given as −
$$VSWR = \frac{\lambda_{g}}{\pi(d_2-d_1)}$$
Where, $\lambda_g \: is \: the \: guided \: wavelength$
$$\lambda_g = \frac{\lambda_0}{\sqrt{1-(\frac{\lambda_0}{\lambda_c})^2}} \quad where \: \lambda_0 \: = {c}/{f}$$
As the two minimum points are being considered here, this is called as double minimum method. Now, let us learn about the measurement of impedance.
Measurement of Impedance
Apart from Magic Tee, we have two different methods, one is using the slotted line and the other is using the reflectometer.
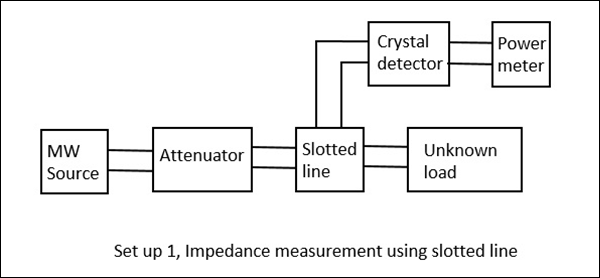
Impedance Using the Slotted Line
In this method, impedance is measured using slotted line and load $Z_L$ and by using this, $V_{max}$ and $V_{min}$ can be determined. In this method, the measurement of impedance takes place in two steps.
Step 1 − Determining Vmin using load $Z_L$.
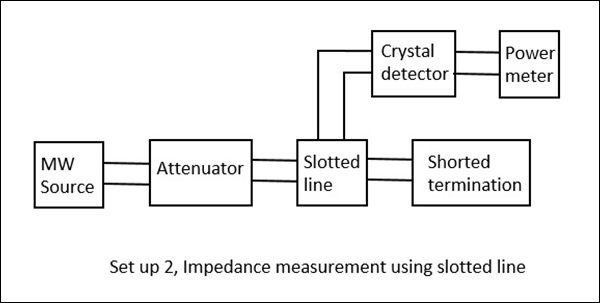
Step 2 − Determining Vmin by short circuiting the load.
This is shown in the following figures.
When we try to obtain the values of $V_{max}$ and $V_{min}$ using a load, we get certain values. However, if the same is done by short circuiting the load, the minimum gets shifted, either to the right or to the left. If this shift is to the left, it means that the load is inductive and if it the shift is to the right, it means that the load is capacitive in nature. The following figure explains this.
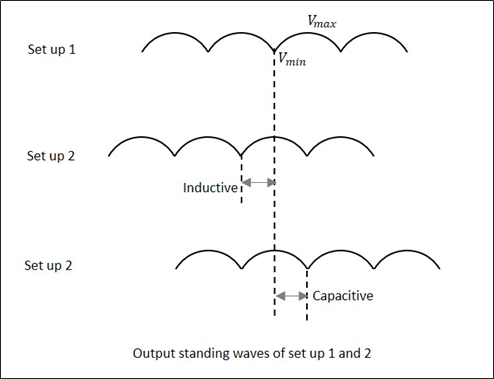
By recording the data, an unknown impedance is calculated. The impedance and reflection coefficient $\rho$ can be obtained in both magnitude and phase.
Impedance Using the Reflectometer
Unlike slotted line, the Reflectometer helps to find only the magnitude of impedance and not the phase angle. In this method, two directional couplers which are identical but differs in direction are taken.
These two couplers are used in sampling the incident power $P_i$ and reflected power $P_r$ from the load. The reflectometer is connected as shown in the following figure. It is used to obtain the magnitude of reflection coefficient $\rho$, from which the impedance can be obtained.
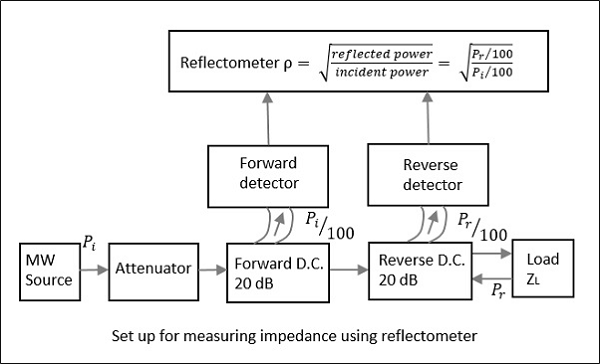
From the reflectometer reading, we have
$$\rho = \sqrt{\frac{P_r}{P_i}}$$
From the value of $\rho$, the $VSWR$, i.e. $S$ and the impedance can be calculated by
$$S = \frac{1+\rho}{1-\rho} \quad and \quad \frac{z-z_g}{z+z_g} = \rho$$
Where, $z_g$ is known wave impedance and $z$ is unknown impedance.
Though the forward and reverse wave parameters are observed here, there will be no interference due to the directional property of the couplers. The attenuator helps in maintaining low input power.
Measurement of Q of Cavity Resonator
Though there are three methods such as Transmission method, Impedance method, and Transient decay or Decrement method for measuring Q of a cavity resonator, the easiest and most followed method is the Transmission Method. Hence, let us take a look at its measurement setup.
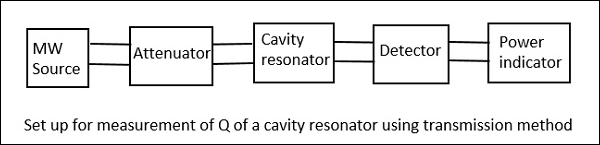
In this method, the cavity resonator acts as the device that transmits. The output signal is plotted as a function of frequency which results in a resonant curve as shown in the following figure.
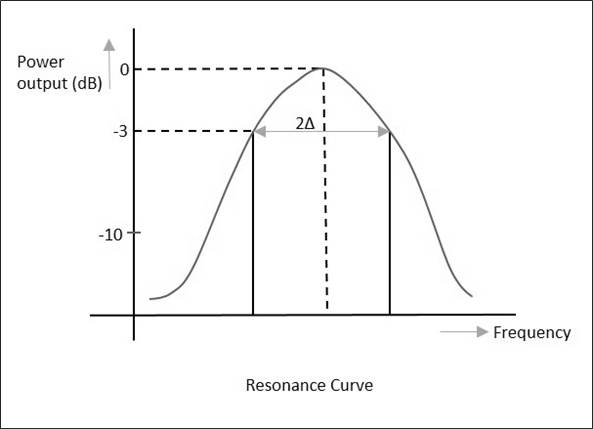
From the setup above, the signal frequency of the microwave source is varied, keeping the signal level constant and then the output power is measured. The cavity resonator is tuned to this frequency, and the signal level and the output power is again noted down to notice the difference.
When the output is plotted, the resonance curve is obtained, from which we can notice the Half Power Bandwidth (HPBW) $(2 \Delta)$ values.
$$2\Delta = \pm \frac{1}{Q_L}$$
Where, $Q_L$ is the loaded value
$$or \quad Q_L = \pm \frac{1}{2\Delta} = \pm \frac{w}{2(w-w_0)}$$
If the coupling between the microwave source and the cavity, as well the coupling between the detector and the cavity are neglected, then
$$Q_L = Q_0 \: (unloaded \: Q)$$
Drawback
The main drawback of this system is that, the accuracy is a bit poor in very high Q systems due to narrow band of operation.
We have covered many types of measurement techniques of different parameters. Now, let us try to solve a few example problems on these.