- MicroStrategy Tutorial
- MicroStrategy - Home
- MicroStrategy - Overview
- MicroStrategy - Environment Setup
- MicroStrategy - Desktop
- MicroStrategy - Architecture
- MicroStrategy - Importing Data
- MicroStrategy - OLAP Services
- MicroStrategy Objects
- Configuration Objects
- MicroStrategy - Public Objects
- MicroStrategy - Schema Objects
- MicroStrategy - Report Objects
- MicroStrategy Basic Reporting
- MicroStrategy - Report Types
- MicroStrategy - Slicing
- MicroStrategy - Dicing
- MicroStrategy - Pivoting
- MicroStrategy - Drilldown
- MicroStrategy - Rollup
- MicroStrategy - Creating Metrics
- MicroStrategy - Nested Metrics
- MicroStrategy Advanced Reporting
- Creating Derived Metrics
- MicroStrategy - Metric Comparison
- MicroStrategy - Creating Filters
- MicroStrategy - Advanced Filters
- Shortcut & Embedded Filters
- MicroStrategy - Refreshing Reports
- MicroStrategy - Intelligent Cubes
- MicroStrategy Dashboards
- Creating a Dashboard
- Formatting a Dashboard
- MicroStrategy - Graph Visualizations
- MicroStrategy - Grid Visualizations
- Heat Map Visualization
- MicroStrategy - N/W Visualization
- Visualization with Multiple Datasets
- Filtering Data in Dashboard
- MicroStrategy - Adding Web Content
- MicroStrategy Office
- Conditional Formatting
- MicroStrategy - Custom Groups
- MicroStrategy - Report Cache Flow
- MicroStrategy - Data Marts
- MicroStrategy - Predictive Models
- MicroStrategy Useful Resources
- MicroStrategy - Quick Guide
- MicroStrategy - Useful Resources
- MicroStrategy - Discussion
MicroStrategy - Slicing
The Slicing operation of a data set involves creating a smaller data set by filtering one dimension. It helps in analyzing the relationship between a given dimension and all the remaining variables of the data set.
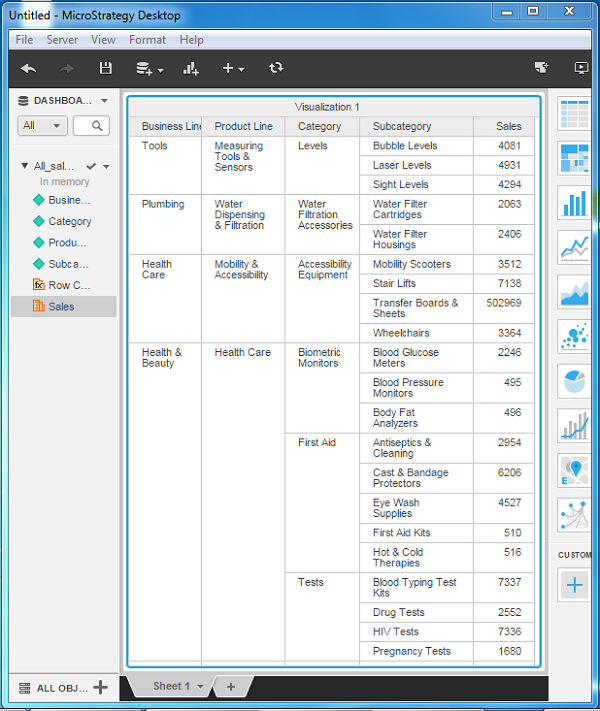
Consider the data set, All-Sales, which contains the following dimensions −
- Business Line
- Product line
- Category
- Subcategory
- Sales
The following screenshot shows a chart with the entire data set projecting all the variables.
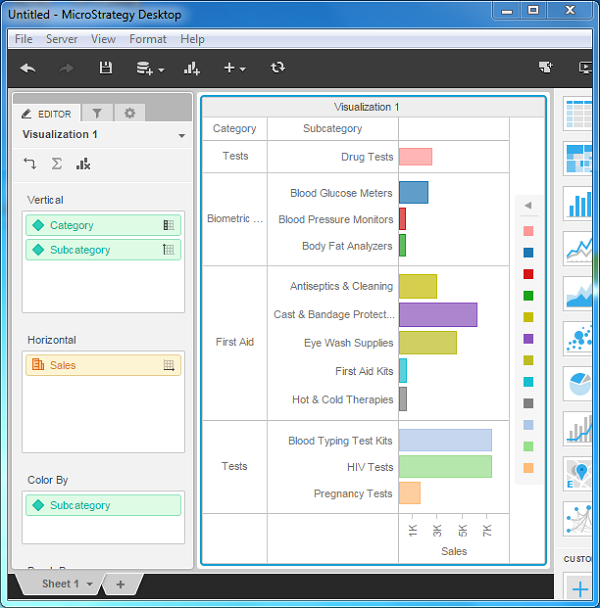
Now, let’s find out the Sales value for each value in the category dimension. For this, we can go to Editor → Visualization, and keep the dimension Category in the vertical axis.
Then keep Sales in the horizontal axis. Also choose the Color By option as sales.
This will produce the following screenshot with the diagram showing the sales data for each category.
Advertisements