- MicroStrategy Tutorial
- MicroStrategy - Home
- MicroStrategy - Overview
- MicroStrategy - Environment Setup
- MicroStrategy - Desktop
- MicroStrategy - Architecture
- MicroStrategy - Importing Data
- MicroStrategy - OLAP Services
- MicroStrategy Objects
- Configuration Objects
- MicroStrategy - Public Objects
- MicroStrategy - Schema Objects
- MicroStrategy - Report Objects
- MicroStrategy Basic Reporting
- MicroStrategy - Report Types
- MicroStrategy - Slicing
- MicroStrategy - Dicing
- MicroStrategy - Pivoting
- MicroStrategy - Drilldown
- MicroStrategy - Rollup
- MicroStrategy - Creating Metrics
- MicroStrategy - Nested Metrics
- MicroStrategy Advanced Reporting
- Creating Derived Metrics
- MicroStrategy - Metric Comparison
- MicroStrategy - Creating Filters
- MicroStrategy - Advanced Filters
- Shortcut & Embedded Filters
- MicroStrategy - Refreshing Reports
- MicroStrategy - Intelligent Cubes
- MicroStrategy Dashboards
- Creating a Dashboard
- Formatting a Dashboard
- MicroStrategy - Graph Visualizations
- MicroStrategy - Grid Visualizations
- Heat Map Visualization
- MicroStrategy - N/W Visualization
- Visualization with Multiple Datasets
- Filtering Data in Dashboard
- MicroStrategy - Adding Web Content
- MicroStrategy Office
- Conditional Formatting
- MicroStrategy - Custom Groups
- MicroStrategy - Report Cache Flow
- MicroStrategy - Data Marts
- MicroStrategy - Predictive Models
- MicroStrategy Useful Resources
- MicroStrategy - Quick Guide
- MicroStrategy - Useful Resources
- MicroStrategy - Discussion
MicroStrategy - Importing Data
MicroStrategy connects to nearly every kind of data source available. It has native connectors, which establish connection with these data sources and also has a connect live feature, which fetches data as and when required. Interestingly, it also shows the icons of data sources for quicker identification of data source you are looking for.
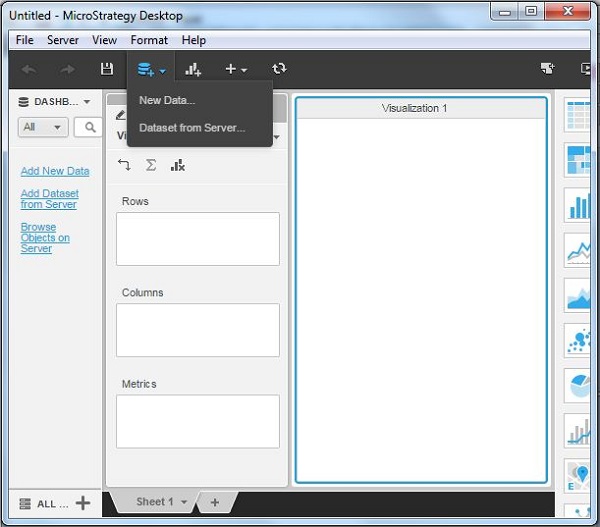
Add Data
The simplest way to search and select the required data set is by using the Add Data option available with a + icon under the main menu. The following diagram shows the steps to add data.
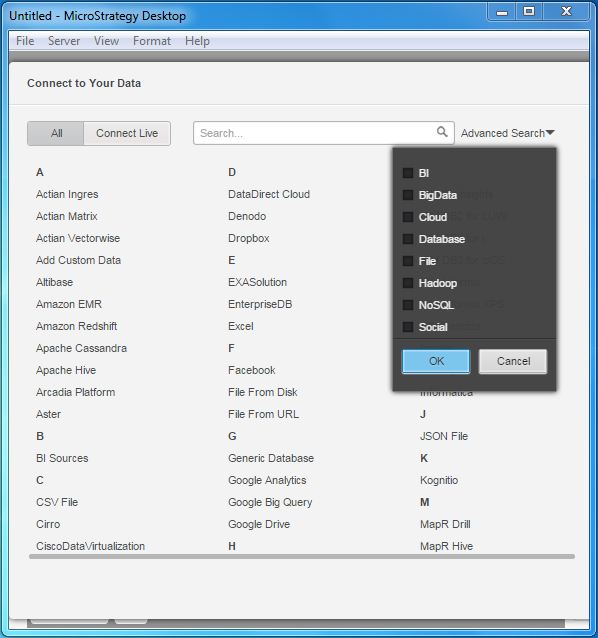
Data Sources
On clicking the Add Data option, we see the icons of various data sources. These help in quickly identifying the data source.
Search Data Source
With this vast number of connection types available, sometimes we need to type in the data source name or filter it from a small group of data set names. MicroStrategy has the feature of advanced search, which makes it possible.
Adding Data from Files
In this section, we will see how to add an excel file as a data source and create a simple visualization.
Select the Excel File
Click the option Add Data and choose Excel available under the alphabetically arranged headers showing E. The window shows a Choose File option and clicking it we can browse the local system to select the required excel file. In the following example, we have a sample file containing the employee data of an organization.
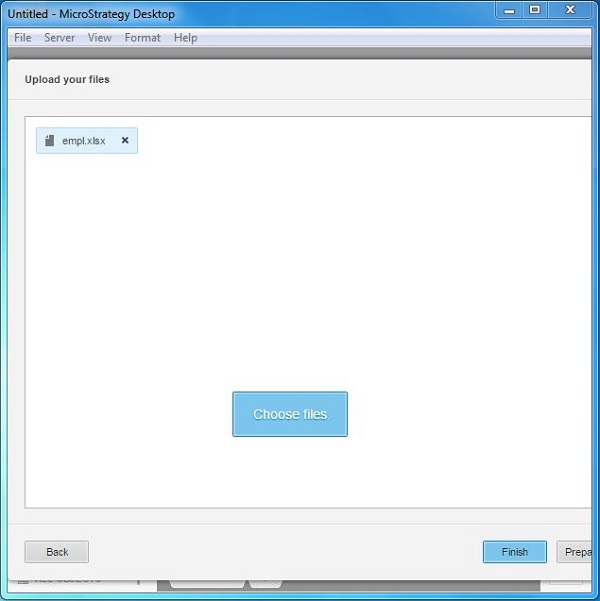
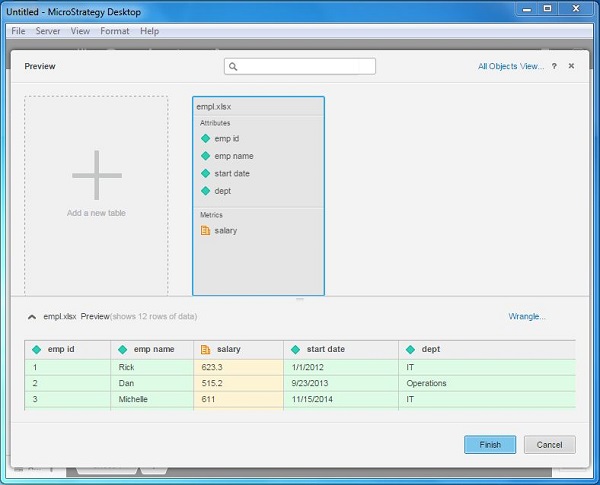
Prepare the Excel File
Before accepting the content of the Excel file, we can preview and also edit the data present in it. Once the file is selected, we can see the button Prepare Data next to the Finish button. Clicking it produces a preview of the data present in the file.
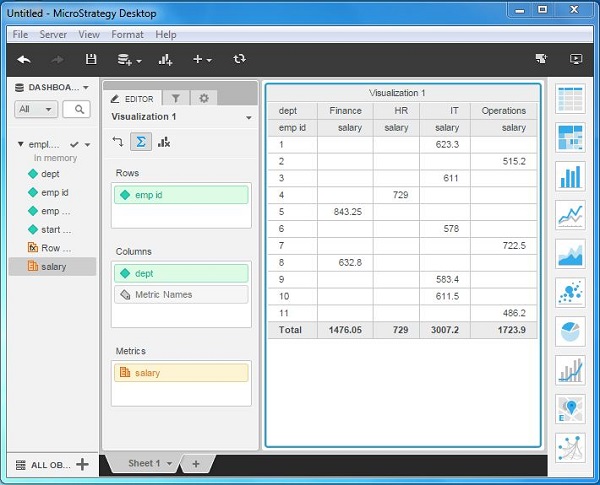
Prepare Visualization
On clicking Finish, after the data is previewed, we are presented with the MicroStrategy window showing the data objects chosen.
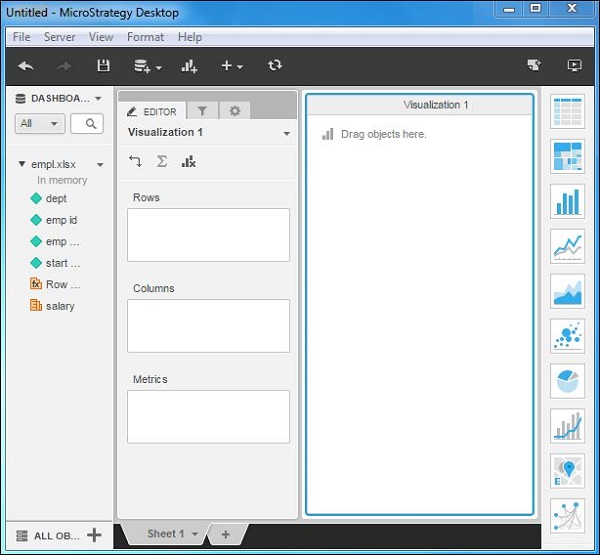
Next, we can create a simple visualization from this data source by dragging the columns in the data source into rows and columns boxes. A metric can also be added. The following diagram shows the final visualization.