- Microsoft Visio Tutorial
- Microsoft Visio Resources
- Microsoft Visio - Quick Guide
- Microsoft Visio - Useful Resources
- Microsoft Visio - Discussion
Listing Shapes Used in Diagrams
Visio has robust auditing and inventory tools built-in that help to quickly review the various components of a diagram. You can extract information such as quantity of each of the shapes used in the diagram, properties of the shapes, text on the shapes, etc. as a table which can help you quickly review and ensure that the document is according to the prescribed specifications. In this example, we will extract a sample report that shows the names of the shapes used and their quantity.
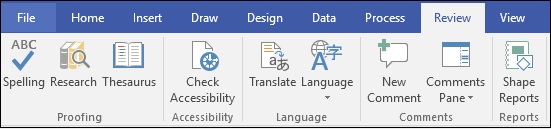
To get an inventory of the document, go to the Review tab on the Ribbon and in the Reports section, click Shape Reports.
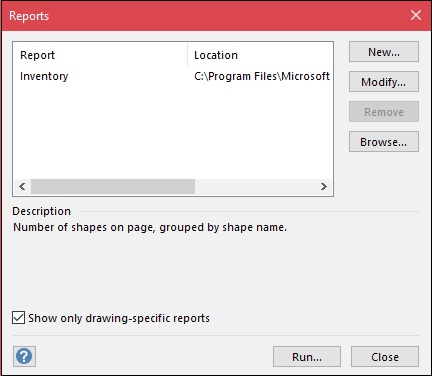
It opens the Reports dialog box. You can create a new report definition by clicking New... or modify an existing report style by clicking Modify…
After selecting the required features of the reports, click Run… to start creating the report.
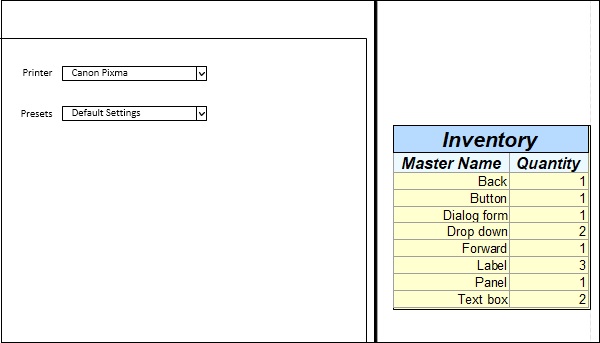
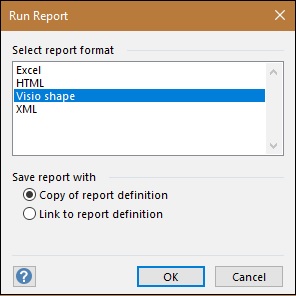
After the report is compiled, the Run Report dialog box opens, which allows to select the format of the report. Generally, it is preferred to export the report as an Excel file to enable easier sorting of data fields but you also have the choice of exporting as HTML, XML, or a Visio shape. Select Copy of report definition in the Save report with section to save a copy of the report within the document and click OK.
Visio creates a report table detailing the features we selected. In this case, the name of the shape and quantity. If you have chosen to save the report as an Excel file in the previous step, clicking the report will open an Excel window within Visio where you can work with the contents of the report.