- Logistic Regression in Python Tutorial
- Home
- Introduction
- Case Study
- Setting up a Project
- Getting Data
- Restructuring Data
- Preparing Data
- Splitting Data
- Building Classifier
- Testing
- Limitations
- Summary
- Logistic Regression in Python Resources
- Quick Guide
- Useful Resources
- Discussion
Logistic Regression in Python - Splitting Data
We have about forty-one thousand and odd records. If we use the entire data for model building, we will not be left with any data for testing. So generally, we split the entire data set into two parts, say 70/30 percentage. We use 70% of the data for model building and the rest for testing the accuracy in prediction of our created model. You may use a different splitting ratio as per your requirement.
Creating Features Array
Before we split the data, we separate out the data into two arrays X and Y. The X array contains all the features (data columns) that we want to analyze and Y array is a single dimensional array of boolean values that is the output of the prediction. To understand this, let us run some code.
Firstly, execute the following Python statement to create the X array −
In [17]: X = data.iloc[:,1:]
To examine the contents of X use head to print a few initial records. The following screen shows the contents of the X array.
In [18]: X.head ()
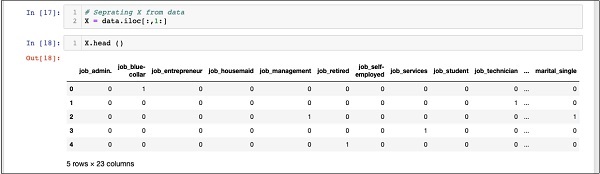
The array has several rows and 23 columns.
Next, we will create output array containing “y” values.
Creating Output Array
To create an array for the predicted value column, use the following Python statement −
In [19]: Y = data.iloc[:,0]
Examine its contents by calling head. The screen output below shows the result −
In [20]: Y.head()
Out[20]: 0   0
1    0
2    1
3    0
4    1
Name: y, dtype: int64
Now, split the data using the following command −
In [21]: X_train, X_test, Y_train, Y_test = train_test_split(X, Y, random_state=0)
This will create the four arrays called X_train, Y_train, X_test, and Y_test. As before, you may examine the contents of these arrays by using the head command. We will use X_train and Y_train arrays for training our model and X_test and Y_test arrays for testing and validating.
Now, we are ready to build our classifier. We will look into it in the next chapter.