- Indian Economy Tutorial
- Indian Economy - Home
- Indian Economy - Introduction
- Indian Economy - Planning
- Indian Economy - Sectors
- Indian Economy - Demography
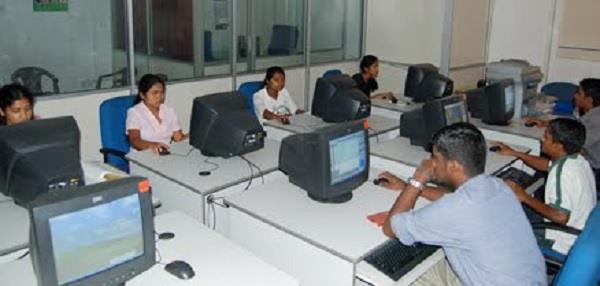
- Indian Economy - People As Resource
- Indian Economy - National Income
- Indian Economy - Poverty
- Indian Economy - Food Security
- Indian Economy - Employment
- Indian Economy - Infrastructure
- Indian Economy - Rural Development
- Indian Economy - Money & Banking
- Economy - Government Budget
- Indian Economy - Consumer Rights
- Indian Economy - Reforms
- Indian Economy - Open
- Indian Economy - Micro Economics
- Indian Economy - Macro Economics
- Economy - Sustainable Development
- Indian Economy Useful Resources
- Indian Economy - Online Quiz
- Indian Economy - Online Test
- Indian Economy - Quick Guide
- Indian Economy- Useful Resources
- Indian Economy - Discussion
Indian Economy - Quick Guide
Indian Economy - Introduction
Economy before British Rule
To understand the present level of the Indian economy, it is important to understand the economic system of India during the British rule and post-independence economic development policies.
Before the advent of British rule, India had an independent economy. It was largely primary sector economy and the major occupations were agriculture, handicrafts, and many other primary sector works.
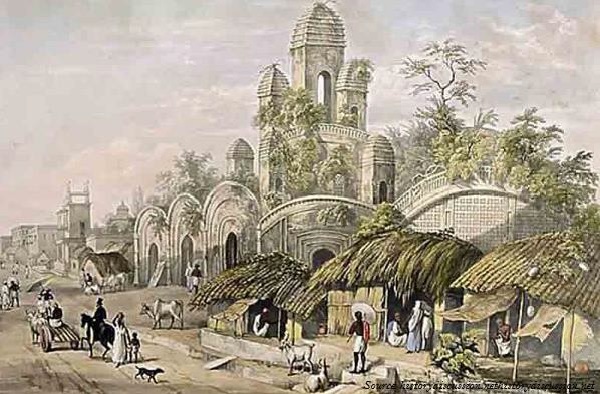
The economy was full of resources and a prosperous one. Therefore, high quality agricultural products and handicrafts made by the Indians were traded across the world.
Economy during British Rule
During the British rule, India’s economy became a net raw material supplier and a net importer of finished products.
No British economist attempted to measure the per capita income and national income of India.
Some of the Indian economists Dadabhai Naoroji, V.K.R.V. Rao, R.C. Desai and British Findlay Shirras and William Digby attempted to measure India’s national income. Among all, V.K.R.V. Rao was the most successful.
Before independence, India’s economy was solely dependent upon agriculture.
85 percent of the Indian population were rural and their main source of subsistence was agriculture.
During the British colonial period, agriculture (in spite of being the main occupation) was suffering from many problems and hence the effective growth was zero percent.
Land settlement system was totally in favour of the British.
Agricultural system was stagnant; however, later there was a gradual growth, but that was not because of improvement and development of the agricultural system, but because of the expansion of agricultural land.
Zamindari System
Many parts of India (especially Bengal region of east India, today’s West Bengal and Bangladesh) were practising Zamindari system (Land-lordship).
The main work of the Zamindars was to collect the land tax/rent. They almost did nothing either to improve the agriculture system or the conditions of the farmers.
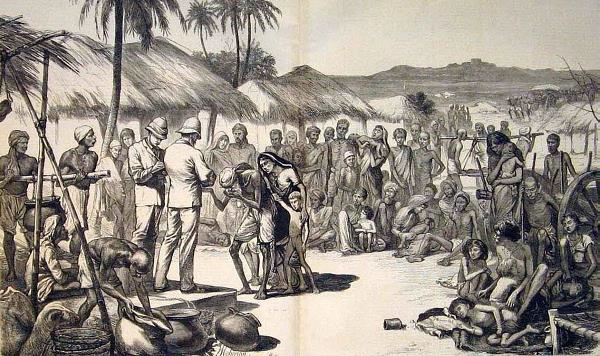
Zamindars’ inhumane attitude affected farmers’ lives very badly. Most of the regions of the country were facing famine and many other social issues and problems.
Some of the regions, during the Zamindari system, evidenced growth that was only because of the commercialisation of agriculture. In these regions, the farmers had been forced to produce cash crops instead of staple food crops.
Major Problems
The major problems were −
- Drought,
- Flood,
- Poor irrigation system,
- Desalination of soil,
- Absence of technology, and
- Poverty.
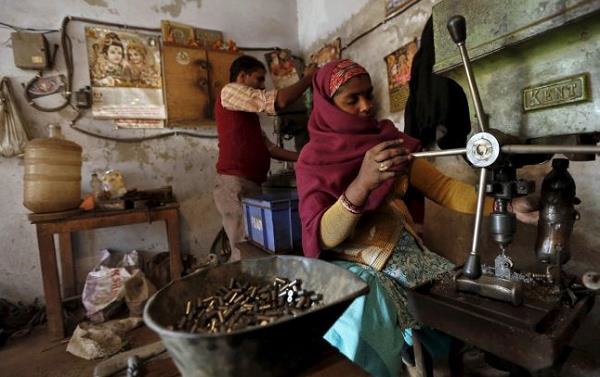
India did not undergo any industrialisation as all the raw materials were exported to the UK.
Handicrafts and other small-scale industries suffered badly.
The main intention of British rule was to make India, a market of their finished products.
In India, many industries developed even in the time of crisis. For example, the jute industry in West Bengal and the cotton textile industry in regions of Gujarat and Maharashtra.
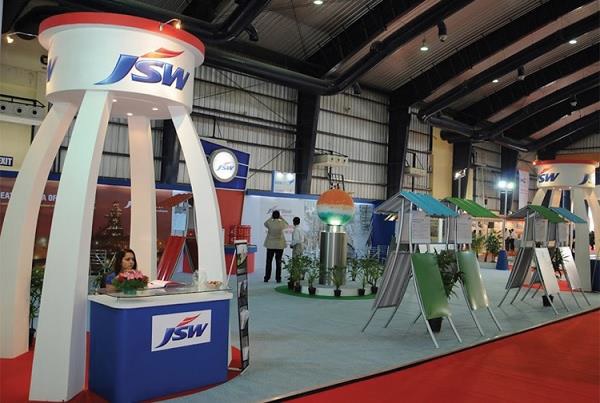
The Industries
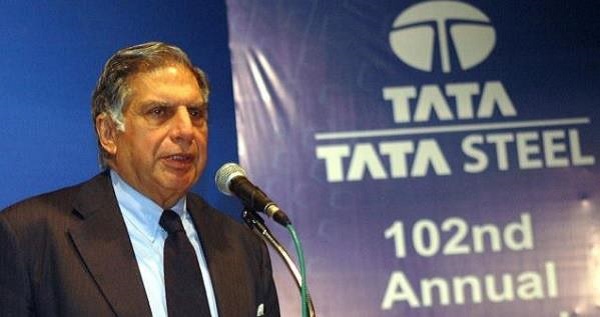
Tata Iron and Steel Company (TISCO) was incorporated in the year 1907.
By the middle of the 20th century, some other industries such as cement, sugar, paper, etc. were established.
As all the above discussed industries were concentrated in some specific pockets of the country; therefore, there was no improvement in the condition of the farmers.
During the colonial period, India became the exporter of jute, cotton, sugar, indigo, wool, etc. and importer of finished products such as cotton and silk fabrics, woollen cloth, machinery, and other items.
More than 50 percent of India’s trade was directed to Britain; remaining 50 percent were traded in other countries including China, Sri Lanka, and Persia (Iran).
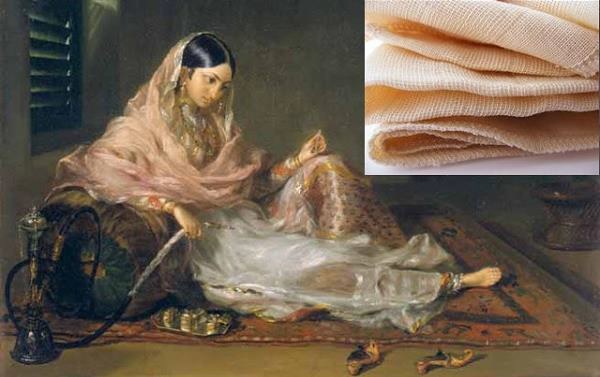
‘Muslin’ is a type of cotton textile which originated in Bengal, particularly, places in and around Dhaka (previously Dacca), now the capital city of Bangladesh. Hence, it was also popular as ‘Daccai Muslin’.
Because of its quality, Muslin earned popularity across the world. Sometimes, foreign travelers also used to refer to it as malmal shahi or malmal khas implying that it was worn by, or fit for, the royalty .
The following image shows the dress made up of Muslin (the dress worn by the lady) and inset (image) shows the Muslin fabrics.
Other Facts
The surplus income of India was used in setting up the official infrastructure for the British officers.
During the British period, some of the infrastructure such as road, rail, telegraph, ports, water transport, etc. were developed, but all these were developed not for the benefit of Indians, but, rather to serve the interests of British officials.
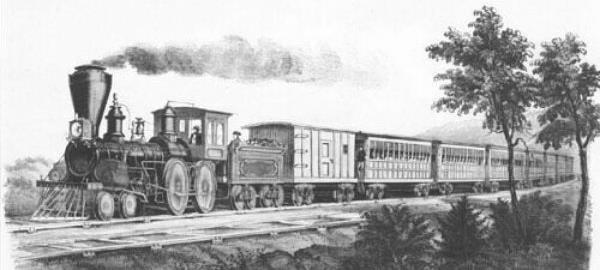
The railway, which was developed in the 1850s broke the barrier of long distance travel and trade. It also fostered the commercialisation of Indian agriculture. But this could hardly be of any help to the farmers.
The regional disparity was high, as the Madras Presidency (entire South India) was more into manufacturing and services sector and rest of India was in the agricultural sector.
Indian Economy - Planning
Introduction
After independence, one of the most difficult choices that the leaders had to make was to decide the type of economic system that was capable enough to promote welfare equally across the country.
Among different types of economic system, Pandit Jawaharlal Nehru, the first Prime Minister of India, suggested
Socialist Economy;
however, it was not the same that was practiced in the USSR.After great efforts, the planning committee decided to adopt a mixed economic system − a judicious mix of both socialist and capitalist systems.
Mixed economy was finally chosen with the help of Industrial Policy Resolution of 1948 and Directive Principle of Indian Constitution.
Planning Commission was set up in 1950, and the Prime Minister of India was made the chairperson of the commission.
Five-year Plans
The First Five-Year Plan was one of the most important as it paved for the development of the country then and for the years to come.
Five-Year Plans are formulated very systematically in which all the problems are considered and addressed on priority basis. For example, agriculture development wasthe most important after independence, hence, the first five-year plan was drafted to strategically propel its growth and development.
Goals of Five-year Plan
Any plan should have a specific goal to fulfil. The goals of the Five-Year Plans are mentioned in the following image −
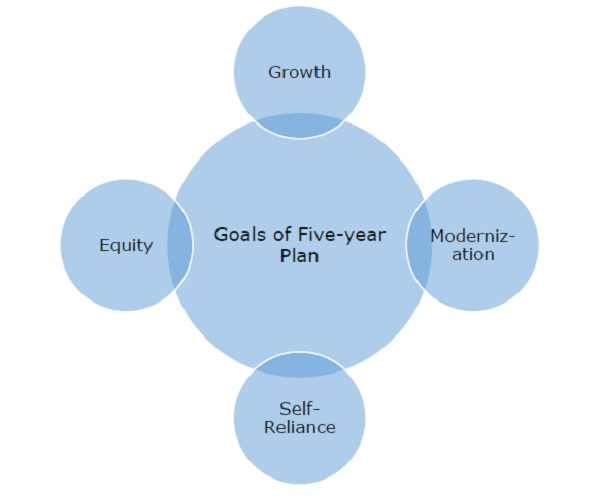
Growth
This goal was directed towards an increase in Gross Domestic Product (GDP) of the country. The different sectors of the economy — the agricultural sector, the service sector, and the industrial sector are considered when a country’s GDP is derived.
Modernization
For the swift growth and also to increase the productivity, modernization was necessary; hence, new agricultural technology (use of machinery and hybrid seed varieties) as well as advanced machinery for factories were used.
Apart from the modern technology, social status of women was also considered and they were granted equal rights.
Self-Reliance
To develop all the sectors and make India a self-reliant country, only indigenous resources and technology were promoted during the first seven five-year plans.
Another purpose of self-reliance was − India did not want to depend on any other country for food and important technologies, as it could be a threat to country’s sovereignty as well.
Equity
The above mentioned goals would not be fruitful or lead to the betterment of the people unless there is equality.
To ensure equity, the following steps have been taken −
Implementation of the Land Reforms Act was a turning point under which, the government abolished the existing ‘Zamindari’ system and the tillers (farmers) were made the owners of the respective land.
Land Ceiling was another commendable act under which the maximum size of land plots an individual can own was fixed.
The purpose of land ceiling was to prevent the concentration of land ownership in the hands of few people.
There were some loopholes in the land ceiling law and the implementation methods were also poor; therefore, the land ceiling was not as successful as it should have been. Only Kerala and West Bengal adopted this policy with full commitment.
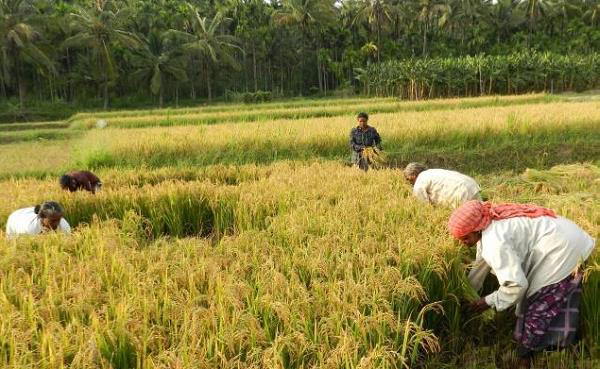
The Green Revolution marked a significant change in the field of agriculture in India. It promoted the use of High Yielding Variety (HYV) seeds. This further increased the yield of wheat and rice.
Primarily, the use of HYV seeds was limited to a few states — Punjab, Andhra Pradesh, and Tamil Nadu, but after the late 1970s, many other states also started benefitting from the use of HYV seeds and improved the agricultural production on their fields.
Use of HYV seeds benefited farmers in the form of market surplus, i.e., farmers were now producing sufficient grains that could also be sold into the market.
For the equal distribution and fair opportunity among rich and poor farmers, the government made a policy to provide agricultural loans to farmers at subsidized rates.
Debate on Subsidy − Many economists accepted that the subsidies are good for the grass root level development, but there were a few who questioned it. However, unquestionably, subsidies brought change in India and proved beneficial for the farmers.
A major drawback is that about 65 percent of the population is still occupied in the agriculture sector and is not finding employment in any other sector.
Because of several problems and issues including poor infrastructure, lack of proper policy, lack of skilled human resources, the industrial sector could not undergo development until independence. Over a period of time, formulation of several industrial policies and the development of infrastructure merged in to mark the progress of the industrial sector in India.
The focus of the second five-year was industrial growth. All major industries, that drove the progress of the Indian economy were in the public sector and the government’s control over these increased during this period.
Industrial Policy
Industrial Policy Resolution is a resolution adopted by the Indian Parliament in 1956. It was formulated under the Second Five-Year Plan.
This resolution categorized industries into three sectors −
- State owned industry;
- Mixed i.e. state and private individual running industry together; and
- Private sector.
According to the industrial policy, the private sector (industry) was also kept under the state control. To open a new industry or to expand an existing one, the first prerequisite was to obtain a license from the government. Small Scale Industry.
In 1955, Village and Small-Scale Industries Committee (which is also known as Karve Committee) proposed to promote small-scale industries for rural development.
To set up a small-scale industry in those days, maximum investment one could make was Rs.5 Lakh. The limit has gone up to Rs.1 Crore now.
Trade Policy
As self-reliance was the primary objective, trade policy was not in favour of import of foreign goods.
Import taxes of various goods were very high. This thereby, increased the cost of the goods in the target market.
In addition to the above discussed conditions, quotas were also imposed and these quotas had an effect on the supply of these imported goods.
This system was practiced only to protect domestic firms from the foreign competition.
Thanks to these policies, results were also positive; GDP increased from 11.8 percent (1950-51) to 24.6 percent (1990-91) and the industrial growth rate was a remarkable 6 percent.
After the implementation of the Trade Policy, industries were no more limited to just jute and textile, rather, they expanded their operations and new units were started.
In spite of a significant growth, many economists criticized the economic policy, as it was largely controlled by the government. For example, in the telecommunication sector, people used to submit their applications months before they could actually get the connection.
There was a huge debate on public vs private sector. Many believe, emphasis on public sector restrained the potential economic growth of India.
On the other hand, the regulation of private sector through licensing system (which people call permit license raj) curtailed the industrial growth potential of the country.
High import tax and restriction on foreign trade also drew criticism.
With the introduction of the new liberal economic policy of 1991, Indian economy addressed the prevailing economic problems through the following −
- Liberalization
- Privatization
- Globalization
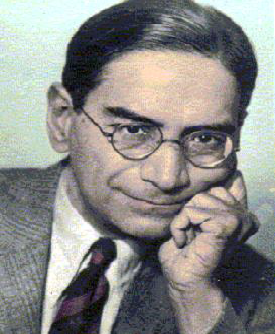
Prasanta Chandra Mahalanobis
Many of the economists and other scholars contributed to the formation and nurturing of the Indian economic system.
Some of them were simply outstanding and their names cannot be forgotten. For example, statistician Prasanta Chandra Mahalanobis.
P.C. Mahalanobis is a well-known architect of Indian Planning
The second five-year plan (which in a real sense, was the beginning of economic planning in India), was based on the ideas of Mr. Mahalanobis.
Born and brought up in Calcutta, Mr. Mahalanobis went to Cambridge University (England) for his higher studies. Because of his contribution in the subject statistics, he was appointed as the Fellow (member) of Britain’s Royal Society.
The Indian Statistical Institute in Calcutta was established by Mahalanobis. He also started a journal namely ‘Sankya.’
Indian Economy - Sectors
Introduction
Economy is normally categorized into three sectors namely −
- Primary Sector
- Secondary Sector
- Tertiary Sector
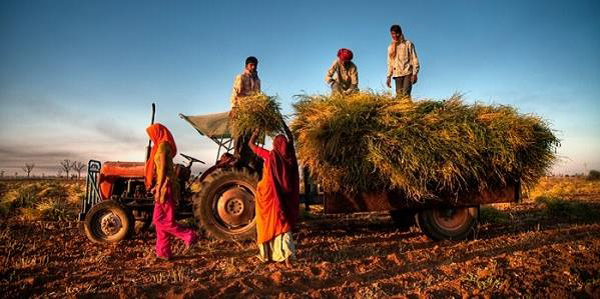
Primary Sector
Primary Sector is directly dependent on environment for manufacture and production. For example, agriculture, mining, farming etc.
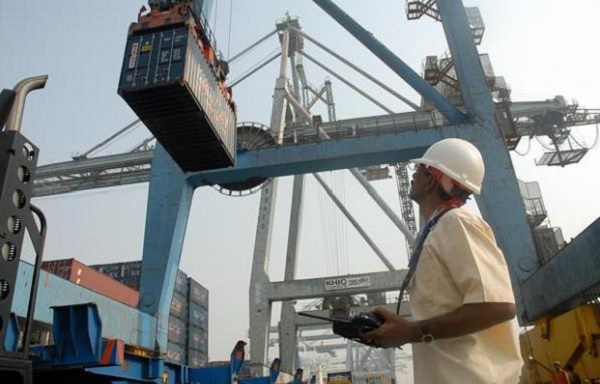
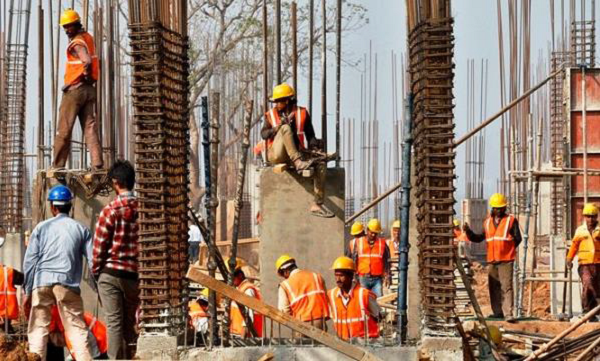
Secondary Sector
Secondary Sector adds value to the produ by transforming raw materials into valuable products. For example, processing and construction industries.
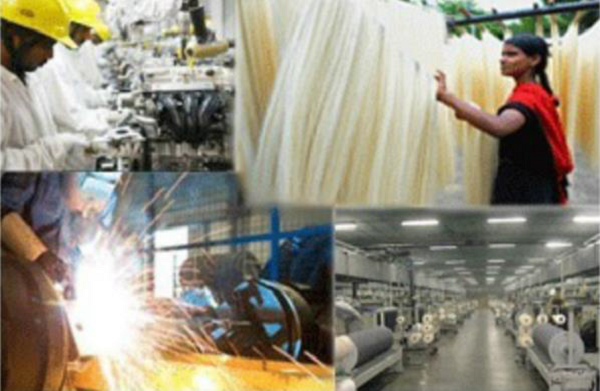
Tertiary Sector
Tertiary Sector is involved in production and exchange of services. For example, transportation, communication, and other services of such kind.
Tertiary Sector is also known as Services Sector as it facilitates the production and exchanges of services.
Measurement of Economy
Gross Domestic Product (GDP) is the value of all goods and services produced by all the three sectors over a period of time.
The majority of workers employed in a particular sector illustrate the economic and technological advancement of the country. For example, if the majority of the people of a country is employed in a primary sector or secondary sector, it means, this country is at a developing stage; whereas, if most of the people are employed in the tertiary sector, it means the country is at a developed stage. Considering this statement we can say that India is a developing country.
India started its growth from the primary sector and over a period of time gradually developed itself in the other sectors too.
The tertiary sector contributes the most to the GDP of our country.
The primary sector still has a large portion of India’s population occupied in it.
Workers in the primary sector remain unemployed for most of the time in a year; hence, if some of these workers are transferred from the primary sector to other sector, there would be no change in the total production of the primary. This type of unemployment is known as disguised unemployment.
The problems of disguised unemployment can be mitigated by improving the level of transport and communication in the rural areas. This will help the people living in these parts to commute from place to another for employment reasons.
We need to promote alternative sources of income such as small scale industries. These industries generate employment opportunities for many who are under employed or totally unemployed.
As per the government’s policy known as National Rural Employment Guarantee Act 2005 (NREGA 2005), all people who are able to, and are in need of work will be given guaranteed 100 days’ employment in a year.
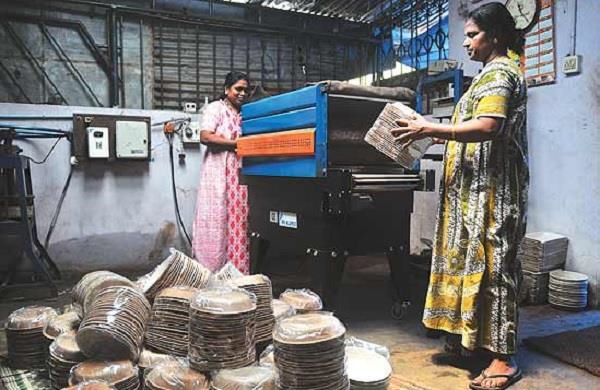
Organized Sector
The sector that is permanently established and offers permanent jobs is known as Organized Sector.
Employees of organized sector work for fixed number of hours in a day. If any employee works beyond the fixed number of hours, then he/she will be paid for the overtime.
Besides, employees of the organized sector have many advantages such as paid leave, weekly off (paid), festival holiday (paid leave), provident fund, gratuity, and some other perks and incentives.
Unorganized Sector
Unorganized Sector consists of all unincorporated private enterprises owned by individuals or households engaged in the sale or production of goods and services operated on a proprietary or partnership basis and with less than ten total workers. The employees here are not guaranteed of any advantages as in the organized sector and there is no concept of overtime payment. Disadvantages like low wages and job insecurity prevail here.
Because of faulty and weak government’s policies and corruption, employees of unorganized sectors are facing exploitation in the hands of their employers.
There are many organized sectors that (to evade the tax) manufacture their goods and services by informal means and for that force their employees to work for extra hours or work in unorganized sector. As these workers are largely illiterate and poor; hence, they don’t have any other option.
Government needs to make protective laws and take sincere action to protect the rights of these vulnerable workers.
In addition to the above discussed points, the government could also play a significant role in areas such as −
Children’s education.
Providing employment to poor people.
Giving subsidies to the people living below the poverty line.
Providing basic medical facilities, drinking water, and other sanitation facilities.
Indian Economy - Demography
Introduction
Hauser and Duncan defined Demography as
the study of the size, territorial distribution, and composition of population, changes therein, and the components of such changes
.
Population Status B/W 1881 and 1941
The first synchronous Census in India was conducted in 1881.
Thereafter, censuses are being conducted at ten-year intervals.
India’s growth in population remained very low till 1921. Until 1921, India was it’s first stage of demographic transition.
The literacy rate was terribly low at 16 percent out of which female literacy accounted to 7 percent.
The lack of public health system was a major drawback. There were outbreaks of water-borne and other fatal diseases. These diseases caused more illnesses and deaths. This led to an increase in the mortality rates.
Infant mortality rate was 218 per thousand (at present, it is about 63 per thousand).
The average life expectancy was only about 44 years.
Agricultural Sector had the largest workforce i.e. about 70—75 percent. This sector was followed by the Service Sector at 15—20 percent, and the Manufacturing Sector at about 10 percent.
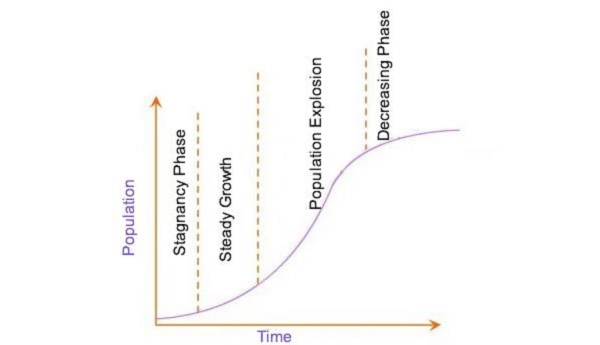
Phase of Population Growth
India’s population growth can be classified into four distinct phases −
Phase I, the period between 1901 and 1921: During this period, India experienced a fluctuating but more or less a stagnant growth in population. This period marked a high in both the birth and death rates.
Phase II, the period between 1921 and 1951: This period witnessed a steady declining trend in population growth.
Phase III, the period between 1951 and 1981: It was a rapid high growth period of population explosion in India.
Phase IV, from 1981 to till date: India continues to grow in size. But, its pace of net addition is on the decrease.
As per census 2011, 68.8 percent of the total population reside in villages and 31.2 percent reside in the urban areas.
Indian Economy - People As Resource
Introduction
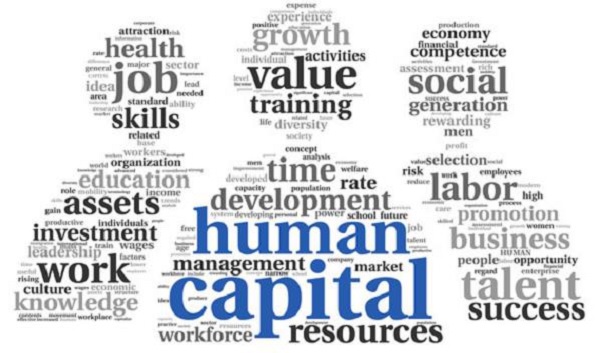
Knowledge is the most significant and valuable property of a human being.
Human resource has a great contribution to the Gross National Income.
Human resources development is the process of increasing the knowledge, the skills, and the capacities of all the people in a society. It is the accumulation of human capital.

Human capital is more superior to other types of resources (such as land and other natural resources), as human capital has the capability to exploit these resources and use them for other developmental purposes.
Economists and experts of other fields have advocated that education should be made accessible to every stratum of the society. Education is indispensable for overall national growth.
Features of Human Capital
Transformation of a child into a successful educated man/woman after educational attainment (for example, doctor, engineer, teacher, government official, business man, etc.) facilitates the development of the human capital.
Human capital is the sole source of overall development of the nation; therefore, investment in a child’s education, health, and other activities related to his/her growth is equivalent to the capital formation.
Health expenditure includes preventive medicine (e.g. vaccination), curative medicine (medicines given during the illness), and social medicine (spreading the health literacy).
Providing training either in public sector or private sector is also a kind of investment that produces knowledgeable and expert employees.
Expenditure on human migration and acquiring information about the market is also a source of human capital formation.
The contribution of a skilled and highly educated person is much more valuable than that of an unskilled labourer.
The seventh five-year plan has emphasized on the need for human capital formation. It stated that
Human resources development (read human capital) has essentially to be assigned a key role in any development strategy, especially in a country with huge population
.Though the two terms human capital and human development sound similar, there is a basic difference between them.
Education and health are the major assets of human capital that enhance the labour productivity.
On the other hand, human development considers education and health as an integral part of human well-being.
Human Capital considers human beings as a means to an end. So, if an educated person with good health does not increase productivity, then the investment made on goes futile.
The expenditure on education is measured on the basis of the percentage of total expenditure (by the government) and the percentage of Gross Domestic Product (GDP).
In 1998, the Government of India appointed Tapas Majumdar Committee to estimate the expenditure in education sector.
The Right to Education Act of 2009, makes education a fundamental right for all children aged between 6 and 14.
The percentage of expenditure on education sector has also been increased in comparison to previous decades.
Various loan schemes have been made available for higher studies (in home country and also other countries).
Moreover, with consistent efforts by the Indian Government, the literacy rate of India is increasing at an appreciable rate.
Besides, the gap between male and female literacy rate has progressively narrowed.
Success Rate of Education in India
The following table illustrates the literacy growth rate −
| Numbers | Details | 1990 | 2000 | 2008-12 |
|---|---|---|---|---|
| 1 |
Adult Literacy Rate (Age group 15+) Male Female |
61.9 37.9 |
68.4 45.4 |
76.7 67.6 |
| 2 |
Youth literacy rate (Between 15 & 24) Male 88 Female 54.2 64.8 74 |
76.6 54.2 |
79.7 64.8 |
88 74 |
| 3 |
Primary completion rate Male Female |
78 61 |
85 69 |
96.6 96.3 |
Education and Life Expectancy Development Rate
The following table illustrates the life expectancy growth rate −
| Details | 1951 | 1981 | 1991 | 2001 | 2012 | |
|---|---|---|---|---|---|---|
| Per Capita Income | 5,708 | 8,594 | 11,535 | 16,172 | 38,037 | |
| Literacy Rate (in %) | 16.67 | 43.57 | 52.21 | 65.20 | 74 | |
Life Expectancy at Birth (In Years) |
Male Female |
37.2 36.2 |
54.1 54.7 |
59.7 60.9 |
63.9 66.9 |
64.7 67.7 |
| Crude Death Rate (per 1,000/) | 25.1 | 12.5 | 9.8 | 8.1 | 7 | |
| Infant Mortality Rate | 146 | 110 | 80 | 63 | 42 | |
Indian Economy - National Income
Introduction
The economic wealth or well-being of a country does not only depend upon the possession of resources, it also depends upon the optimum utilization of resources is more important.
The consumer may refer to an individual or enterprise that purchases goods and services for their personal use or for industrial or household use.
When goods are used for further production, they lose their original characteristics and get transformed into other commodities.
An item that is meant for the final use and will not pass through any more stage of production or transformation is called a final good or an end product.
Cooking at home is not an economic activity because home cooked food is not to be sold in the market, but when the same food is cooked in a restaurant for the customers, it becomes an economic activity.
Types of Goods
Goods and services, which are purchased and consumed by their ultimate consumer are called consumption goods or consumer goods. For example, cloth, shoe, pen etc.
Goods, which are durable in nature and used in the production process like tools, machinery and implements are also called final goods because they can’t change themselves at the time of production.
Commodities like television sets, automobiles or home computers are also durable goods, which are used by their ultimate consumer. These commodities are also called consumer durables.
Goods, which are used as raw material or input for the production of other commodities are called intermediate goods. These are not final goods. For example, plastics used for making chair, iron & steel used for making vehicles, etc.
Calculating National Income
Money is the common measuring means for the calculation of total final goods and services produced in the economy.
The calculation of the value of final goods and services does not consider the value of intermediate goods.
Depreciation refers to a fall in the value of fixed assets due to normal wear and tear.
Net investment = Gross investment – Depreciation.
Total final output produced in an economy includes output of consumer goods and services and output of capital goods.
More sophisticated and heavy capital goods raise the ability of a labourer to produce goods. For example, the traditional weaver would take months to weave a sari, but with modern machinery, thousands of pieces of clothing are produced in a day.
There are mainly four kinds if contributions that can be made during the production of goods and services −
Contribution made by human labour (remuneration which is also called wage);
Contribution made by capital (remuneration which is called interest);
Contribution made by entrepreneurship (i.e. profit); and
Contribution made by fixed natural resources/land (remuneration which is called rent).
In a simple economy, the aggregate consumption by the household of an economy is equal to the aggregate expenditure on goods and services produced by the firm in the economy.
There is no leakage from the economic system because in a simple economy, we assume that there is no government; where there is no government, there is no tax payment, there are no exports and imports and that the domestic economy is a closed economy.
Value added, is the term, which is used to denote the net contribution made by a firm during the production process.
The replacement investment is always the same as the depreciation of the capital.
If we include depreciation in the Value Added, we obtain Gross Value Added and when we deduct the value of depreciation from Gross Value Added, we obtain the Net Value Added.
The stock of finished goods, or semi-finished goods, or raw materials, which a firm carries from one year to the next year is called inventory.
Change of inventories of a firm during a year = production of the firm during the year – sale of the firm during the year.
Production of the firm = value added + intermediate goods used by the firm.
Change of inventories of a firm during a year = value added + intermediate goods used by the firm during a year.
The change in inventories taking place over a period of time is called flow variables.
Addition to the stock of capital (like inventories) of a firm is known as investment.
There are mainly three categories of investment −
The rise in the value of inventories of a firm over a year, which is treated as investment expenditure undertaken by the firm;
The fixed business investment, which is defined as the addition to the machinery, factory buildings, and equipment employed by the firms; and
The residential investment, which refers to the addition of housing facilities.
If there is unexpected fall in sales, there will be an unplanned accumulation of inventories, but if there is unexpected rise in the sales, there will be an unplanned shortage of inventories.
Gross value added (GVA) = Value of sales by the firm + Value of change in inventories – Value of intermediate goods used by the firm.
Net value added of the firm = Gross Value Added – Depreciation of the firm.
Net value added of the firm = Gross Value Added – Depreciation of the firm.
Gross Domestic Product of the economy is the sum total of the net value added and depreciation of all the firms of the economy. Summation of the net value added of all firms is called Net Domestic Product (NDP).
The final expenditure is calculated on the following accounts −
The final consumption expenditure on the goods and services produced by the firm.
The final investment expenditure incurred by other firms on the capital goods produced by a firm.
The expenditure that the government makes on the final goods and services produced by a firm.
The export revenues that a firm earns by selling its goods and services abroad.
According to the expenditure method, GDP = Sum total of all the final expenditure received by the firms in the economy.
When government expenditure exceeds the tax revenue earned by the government, it is called the budget deficit.
When import expenditure is more than the revenue earned from export, it is called the trade deficit.
Gross National Product = GDP + Factor income earned by the domestic factors of production employed in the rest of the world – Factor income earned by the factors of production of the rest of the world employed in the domestic economy.
If we deduct depreciation from GNP, the measure of aggregate income that we obtain is called Net National Product (NNP). Thus, NNP = GNP – Depreciation.
Income which is earned by a household is called Personal Income.
Personal Income (PI) = National Income – Undistributed profits – Net interest payments made by households – Corporate tax + Transfer payments to the households from the government and firms.
Personal Disposable Income (PDI) = Personal Income – Personal tax payments – Non-tax payments.
National Disposable Income = Net National Product at market prices + Other current transfers from the rest of the world.
Private Income = Factor income from net domestic product accruing to the private sector + National debt interest + Net factor income from abroad + Current transfers from government + Other net transfers from the rest of the world.
Real GDP is calculated at constant price (base year price) of goods and services; on the other hand, Nominal GDP is calculated at the current price of goods and services.
In the calculation of real and nominal GDP of the current year, the volume of production is fixed.
The ratio of nominal to real GDP is known as index of prices it is also known as GDP Deflator.
Methods for Measuring National Income
There are different methods of estimating National Income. The methods are as follows −
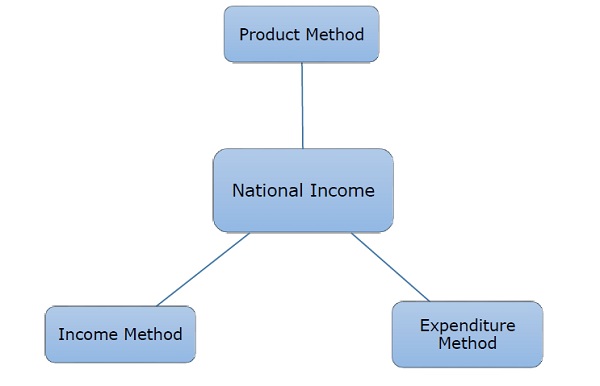
In product method, national income is measured on the basis of the flow of goods and services. We calculate money value of all final goods and services produced in an economy during a year.
In expenditure method, national income is measured as a flow of expenditure. Government consumption expenditure, gross capital formation (Government and private) and net exports (Export-Import).
In income method, national income is measured as a flow of income factor. There are generally four factors of production −
- Labor (gets wages/salary)
- Capital (receives interests)
- Land (receives rent)
- Entrepreneurship (gets profit as remuneration)
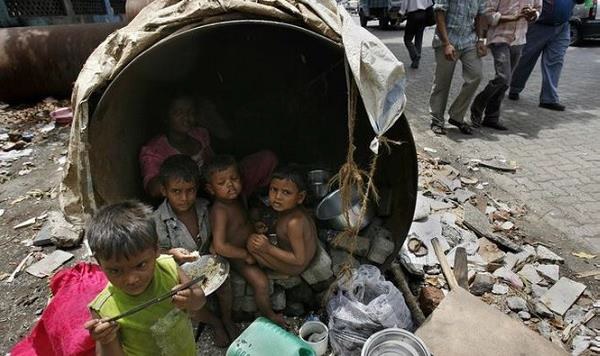
Indian Economy - Poverty
Introduction
Poverty in India is deep rooted. The 200 years under British further intensified it.
After independence, several programs have been brought forward through Five-Year Plans in an attempt to alleviate poverty.
Dadabhai Naoroji was the first person who talked about the concept of
Poverty Line
before independence.Dadabhai Naoroji used ‘jail cost of living’ formula to calculate the poverty line.
The Task Force on Projections of Minimum Needs and Effective Consumption Demand constituted by the Planning Commission in 1979 also attempted to measure poverty.
Poverty is further categorized on parameters such as absolute poor, very poor and poor. Another categorization is based on parameters such as always poor, usually poor, chronic poor, churning poor, etc.
Poverty Measurement
To demarcate the poverty line normally per capita calorie intake parameters is used, under which the minimum calorie intake (which is 2,400 calories/day for people in rural areas and 2,100/day for people in urban areas) is considered.
Many economists criticize the minimum calorie intake technique of measuring poverty because it does not solve many issues and also does not identify the real poor people.
To remove the drawbacks of this technique, many other techniques were invented; significant of them are −
Sen Index (by Nobel Laureate economist Amartya Sen),
Poverty Gap Index, and
Squared Poverty Gap.
Head Count Ratio is the number of poor as the proportion of people living below the poverty line.
In 1973-74, there were more than 320 million people below poverty line; the number has come down to 270 million in 2011-12. Likewise, more than three-fourth of the country’s poor people live in rural areas.
Many of the states in past three and four decades improved and the ratio of poverty declined; however, four states i.e. Odisha, Madhya Pradesh, Bihar, and Uttar Pradesh still have poverty levels, less than the national poverty level.
Reasons of Poverty
The major causes of poverty in India are −
- Illiteracy
- Unemployment
- Unequal distribution of wealth
- Excessive population
- Discrimination on the basis of caste and religion, etc.
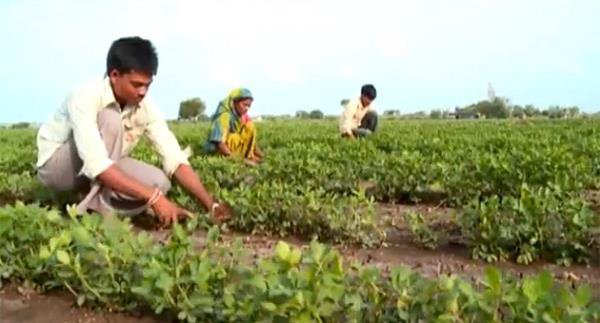
The farmers’ plight is worst in many parts of India. There is an increase in the number of farmers’ suicides especially in Maharashtra, Telangana, and Andhra Pradesh.
There are many reasons that instigate the farmers to take this extreme step −
- High interest rate loans
- Lack of state investment
- Low productivity
- Availability of subsidised or low rate foreign products
- Lack of infrastructure
- No advice for farmers
- Poor irrigation systems
- Spurious seeds and pesticides
- Crop failure (because of drought), etc.
Poverty Reduction Programs
Starting from the first five-year plan, the government has kept on introducing various poverty reduction programs and policies.
The Concept of Trickledown Theory
Growth oriented approach was adopted with the assumption that all sectors would grow, and percolate into every level of society and help to remove poverty.
But even after such growth orientation, the condition has not improved, rather the gap between rich and poor has further widened.
The green revolution further worsened the condition by creating disparity between large and small scale farmers.
A special program — Food for Work aimed at eradication of poverty was launched in the 1970s.
Many other programs including self-employment programmes (listed below) were also launched around the same time −
- Rural Employment Generation Programme (REGP)
- Prime Minister’s Rozgar Yojana (PMRY)
- Swarna Jayanti Shahari Rozgar Yojana (SJSRY)
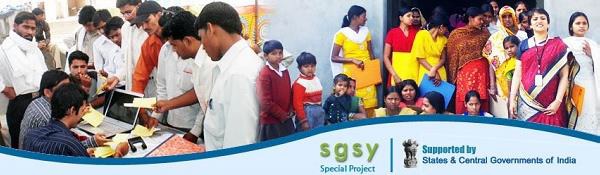
Later in 1990s, the government changed the policy and started promoting Self-Help Groups (SHG). It primarily encourages people to save their own money and lend among themselves. At a later stage, government through banks will facilitate partial financial support.
Swarnajayanti Gram Swarozgar Yojana (SGSY) is an example of SHG. SGSY has now been restructured as National Rural Livelihoods Mission (NRLM).
In the year 2005, the Parliament passed a new Act — Mahatma Gandhi National Rural Employment Guarantee Act. This Act guaranteed wage employment to those rural households whose adult members volunteer to do unskilled manual work for a minimum of 100 days in a year.
During the period 2013-14, about five crore households got employment opportunities and benefitted from this act.
Further, three major programs have been launched to improve the nutritional status of the poor −
- Public Distribution System
- Integrated Child Development Scheme
- Midday Meal Scheme
Some other programs launched for the better of the people in rural areas are −
- Pradhan Mantri Gram Sadak Yojana
- Pradhan Mantri Gramodaya Yojana, and
- Valmiki Ambedkar Awas Yojana
Reasons of Failure
Though a number of poverty reduction programs have been launched by the government the outcome has not been satisfactory enough. There are many areas, which are facing segregation and are being deprived of basic development. The reasons for the underperformance of these programs are −
- Poor execution
- Systemic corruption
- Unequal distribution of land and wealth
- Pressure from the local elite
- Lack of participation by the poor people, etc.
This calls for participation of people from every stratum of the society. This will further facilitate inclusive growth and successful poverty eradication. For this, we need to encourage and educate people to participate from the grass root level.
The following table illustrates the poverty ratio −
| Poverty Ratio | |||
|---|---|---|---|
| Year | Rural | Urban | Total |
| 1993-93 | 50.1 | 31.8 | 44.3 |
| 2004-05 | 41.8 | 25.7 | 37.2 |
| 2011-12 | 25.7 | 13.7 | 21.9 |
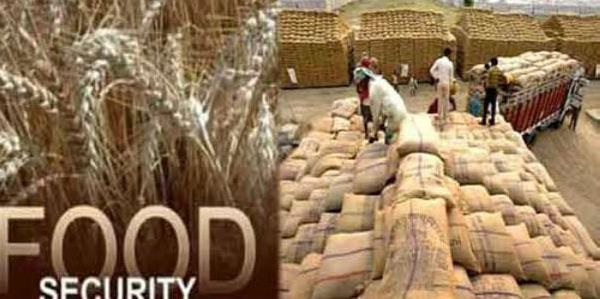
Indian Economy - Food Security
Introduction
Food Security is a comprehensive term that includes −
Availability
Accessibility
Affordability of food for all
Availability of Food means, there should be enough food for everyone irrespective of his or her income; no one should starve (from hunger). It also includes the availability of food in government’s stock.
Accessibility means, every person can have it. Or in other words, its price should not be so high that only a class of people can afford it.
Affordability means, a person should have sufficient money to buy a balanced food for himself/herself and/or for his/her family.
Problems of Food Insecurity
A large section of people in India is facing food insecurity, as they don’t have affordability and accessibility to food even for two times a day.
In addition to this, natural calamities such as drought, heavy rainfall, earthquake, cyclone further increase the level of food insecurity.
Natural calamities directly affect the production of food and lead to food shortage. The demand remains high, but the supply level falls down. Further, natural calamities cause a rise in the price of food, which is beyond the affordability of the poor.
Food insecurity normally leads to Famine. Famine, in fact, is a curse to any society. It brings with it problems such as −
- Food insecurity
- Diseases
- Unemployment, etc.
Vulnerable Groups
The most vulnerable groups that have been suffering with the problem of food insecurity in India are −
The people who don’t have their own land (for agriculture).
The traditional artisans.
The workers (working on daily wages especially on agricultural land).
The seasonal workers (who finds work only in certain seasons).
Self-employed workers such as rickshaw-pullers and hawkers.
The poor people in India normally belong to the Scheduled Castes, the Scheduled Tribes, or other backward classes. There is also a section of poor people in India, who have migrated from neighbouring countries.
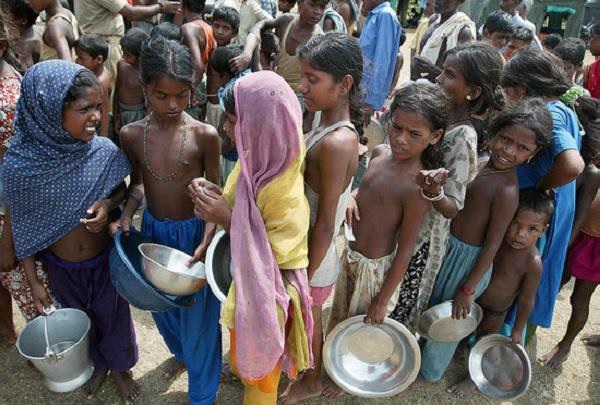
These poor people are more vulnerable to natural calamities or any other disaster.
Hunger Problem
Hunger is another parameter of measuring food insecurity. It includes not only the unavailability of food, but it also reflects the overall poverty of a society.
Hunger could be temporary or seasonal (because of calamity) or permanent (chronic hunger).
Chronic hunger illustrates permanent food insecurity, inadequate food supply, and inability of people to buy food.
Seasonal hunger, on the other hand, occurs temporarily. It is normally related to cycles of food growing and harvesting. For example, people suffering with this problem have inadequate food availabilities for only part of the year.
As per the latest government report, the percentage of seasonal hunger, as well as chronic hunger, has declined over the years in India.
Regions of Food Insecurity
Some Indian states such as Odisha, Bihar, Uttar Pradesh, West Bengal, Jharkhand, Chhattisgarh, Madhya Pradesh, and Maharashtra have extreme levels of food insecurity.
There are still many districts (of a few states), which have permanent food insecurity and famine-like conditions. The districts are −
Kalahandi and Kashipur districts of Odisha.
Palamau district of Jharkhand.
Baran district of Rajasthan, etc.
Development
India, after independence, experienced many remarkable achievements. For example, the introduction of ‘green revolution’ increased the agricultural produce many folds. But the substantial increase in the production of grains (especially rice and wheat) is not equal across the country.
The states Punjab and Uttar Pradesh achieved high growth rate; on the contrary, Jharkhand, Assam, Tamil Nadu, Uttarakhand, recorded decrease in their food grain production (for the year 2012—13).
In spite of all the disparities (discussed above), over the last few decades, India is self-sufficient in the production of food grains.
To mitigate adverse conditions, the Indian government has come up with initiatives such as special food security system (maintaining buffer reserves of food stock) and public distribution system.
Food Security and Governance
Government of India set up a special agency — Food Corporation of India (FCI). The agency is responsible for the execution of food policies of Central Government.
FCI purchases food grains (wheat and rice) from the farmers in states where there is surplus production.
FCI purchases food grains on pre-determined rates (fixed by the government in advance). This price is known as Minimum Support Price.
Later, the government makes the food grains available (from the buffer stock) to the areas where the production of food grains was insufficient and to the poor section of the society.
Government provides a platform where the stock is sold at a lower price (lower than the market rate), which is known as Issue Price.
The system through which FCI makes the food grains available to the poor society is known as Public Distribution System (PDS). The ration shops in most localities, villages, towns, and cities serve as channels and facilitate this distribution system.
The government issues ration cards and the people who have low income can apply and get ration cards from the ration card offices and avail the benefits of PDS.
Only those people, who hold ration cards can purchase subsidised food.
The high levels of food insecurity forced the Indian Government to introduce three food intervention programmes during the 1970s. The programmes are as follows −
Public Distribution System (PDS) for food grains (though it was already existing, the execution of responsibilities was strengthened further).
Integrated Child Development Services (ICDS).
Food-for-Work (FFW).
Currently, there are dozens of such programmes functional across the country.
Targeted Public Distribution System was introduced in 1997. This system aims to focus on the
Poor in all areas.
For this system, different prices are fixed for the poor and non-poor group.The following two schemes have been launched recently −
Antyodaya Anna Yojana (AAY)
Annapurna Scheme (APS)
Reasons of Food Insecurity
In spite of the various initiatives for food security in India, there are many regions suffering from food insecurity.
Some of the major reasons for the failure of these initiatives are −
Poor implementation
Corruption (ration shop owners often sell the food grains of better quality to other buyers and provide food grains of poor quality to the ration card holders);
The process involved in availing a ration card is a lengthy one; etc.
Indian Economy - Employment
Introduction
The motive behind working is not only to earn for ourselves, but also to support our dependents.
Being employed gives a sense of self-worthiness and dignity as well as recognition in the society.
Above all, a working employee not only earns for himself/herself, but he/she also contributes to the national income of the country.
Features of Employment
A study on the employment types and the living style of people gives an information on the following areas −
- National income
- Employment structure
- Management of human resources, etc.
The study helps us analyse the different levels of employment and the levels of income generated by different sectors that contributes to the national income.
On the basis of employment study, we can address the persistent social issues such as poverty, child labour, exploitation, etc
When we calculate all the goods and services produced in a year, it is known as Gross Domestic Product (GDP).
When we add all the earning of exports and deduct the amount paid for import, the final number is known as Gross National Product (GNP).
If the export is greater than the import, then the GNP’s measurement is on positive side and if the export is lesser than the import, then it is on negative side.
Seasonal Unemployment
Employment in India is multifaceted. There are people who are permanently unemployed; and there are people who are temporarily employed or temporarily unemployed (known as seasonal unemployment/employment).
On the other hand, a task that requires only 5 workers to handle it, is being handled by 12 workers. This condition is known as disguised unemployment.
Among all the workers of the country −
70 percent of the workforce are men.
Three-fourth of the workforce is from rural areas.
Women workers account to one-fifth of the total workforce (in urban areas).
Population refers to a group of people living in a given area in a given time period.
As per the 2009-10 data, about 39 persons of every 100 persons, are employed.
In urban areas, the number of employed people is 36 per 100 persons, whereas, it is about 40 per 100 persons in rural areas.
People in the urban areas are more literate, and they have more options to look out for a permanent job. This could mainly be the reason for this gap.
The number of female workers in rural areas (25/100 women) is more than in urban (15/100 women) areas.
The income of the male counterpart in the urban areas is high. Hence, the need for a female member of a family to go and earn does not arise,
The disparity between self-employed workers and salaried workers is also high.
In India, there are more number of men as salaried workers than women.
Types of Service Sector
Service sector is categorised into the following −
Primary sector − It includes agriculture and other related works.
Secondary sector − It includes mining and quarrying, manufacturing, construction, and electricity, gas, water supply, etc.
Tertiary sectoror Services sector − It includes trade, transport and storage, and services.
Primary Sector
Primary sector has the maximum percentage of work force, i.e., about 66% in rural area and 9% in urban area.
In the primary sector, men account to about 43% and women account to about 62.8% of the workforce.
The total percentage of workforce in the primary sector accounts to about 48.9%.
Secondary Sector
Secondary sector has 16% of the workforce in rural areas and 31% of the workforce in urban areas.
In secondary sector, women account to about 20% of the workforce and men account to about 25.9 percent of the workforce.
The total percentage of workforce in secondary sector accounts to about 24.3%.
Tertiary Sector
Tertiary or Service sector has 17.4% of the workforce in rural areas and about 60% of the workforce in urban areas.
In tertiary sector, women account to about 17.2% of the workforce and men account to about 30.5% of the workforce.
The total percentage of workforce in tertiary sector is about 26.8%.
Trend of Employments
The pattern of employment has changed over the last four decades.
The percentage of workforce in primary sector has decreased from 74.3% (in 1972—73) to 48.9% (in 2011—12).
The percentage of workforce in secondary sector has increased from 10.9 (in 1972—73) to 24.3 (in 2011—12).
The percentage of workforce in tertiary sector has increased from 14.8% (in 1972—73) to 26.8% (in 2011—12).
Similarly, the percentage of self-employed workers has come down from 61.4% (in 1972—73) to 52% (in 2011—12).
The percentage of regular salaried employees has gone up from 15.4% (in 1972—73) to 18% (in 2011—12).
The percentage of casual labourers has gone up from 23.2% (in 1972—73) to 30% (in 2011—12).
The workers working in a public sector or other enterprises who hire other workers to get the work done are known as formal workers.
On the other hand, the workers working in a primary sector (farmers, agricultural labourers), owners of small enterprises, are self-employed and do not hire workers. They are known as informal workers.
Formal workers account to only about 6% of the workforce in India, while the other 94% of the workforce are informal workers.
In the formal sector, only 21% of the workers are women.
On the other hand, in the informal sector, about 31% of the workers are women.
Unemployment in India is of different types.
Indian Economy - Infrastructure
Introduction
Infrastructure is an indispensable tool for the development of an economy, as it facilitates supporting services, such as −
- Transportation
- Aviation
- Telecommunication
- Power supply
- Education system (research and development)
- Banking system
- Hospitals
- Trade, etc.
Infrastructure facilitates not only economic development of a nation, but also improves the overall quality of life (of the people).
Initially, the development of infrastructure in India was seen as the responsibility of the Indian Government; however, later private players also came into the picture and started developing infrastructure as government alone was not in a position to take care of the entire development.
Still, a large portion of India has no basic infrastructure in place. People are using wood, cow dung patties, and other primitive means for cooking.
About 76% of the Indian population drinks water from open sources such as tanks, wells, ponds, etc.
Energy
Energy is an essential element for the development of any nation.
India has two sources of energy. They are −
- Commercial sources of energy
- Non-commercial sources of energy
Coal, petroleum, and electricity come under commercial sources of energy. They are exhaustible and non-renewable sources of energy (except hydroelectricity); that get depleted with use.
Firewood, dried dung, and agricultural waste come under non-commercial sources of energy. These are directly available from nature. They are renewable in nature.
The sources of energy, which are exhaustible and can be used only once, are known as conventional sources of energy. They could be both commercial and non-commercial sources of energy.
The major sources of non-conventional sources of energy are −
- Solar energy
- Wind energy
- Tidal energy etc.
By virtue of being a tropical country, India has a great potential of non-conventional sources of energy.
74% of the total energy production is consumed for the commercial purposes.
Coal energy contributes about 54%, oil energy contributes about 32%, natural gas contributes about 10% and hydro energy contributes about 2% of the total energy consumption.
Non-commercial sources of energy — cow dung, firewood, and agricultural wastes collectively contribute about 26% of the total energy consumption.
Power/Electricity is an essential element for the development of any economy. Research says that in order to have 8% growth rate in GDP, power supply needs to go up by 12% annually.
Thermal power produces about 70% of total electricity.
Wind and hydel power collectively contribute about 16% to the total power production.
Nuclear power contributes only about 2%; while the global average is 13%.
Challenges of Energy Generation
There are many challenges related to power generation and consumption.
India does not produce as much power as it actually requires.
There is a disparity in power distribution system.
Poor power sector management has given way to electricity thefts and distribution losses.
The Private sector has very little to contribute in the power sector.
High tariff rates and power cuts are the other challenges.
A major portion of India’s electricity is coming from thermal power, but the source (raw material i.e. coal) is getting exhausted.
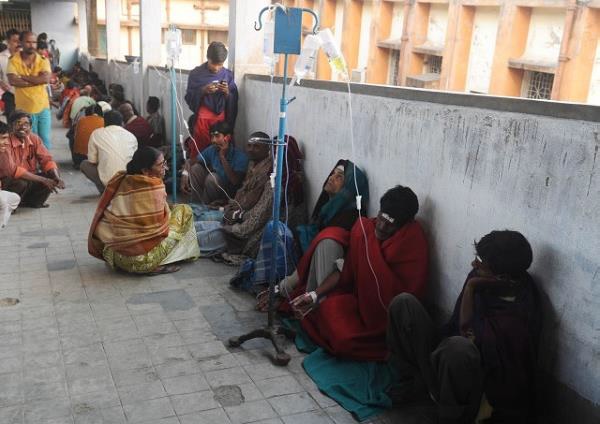
Health Sector
Health status of a country reflects the level of development, i.e., overall development of the nation.
The development of health infrastructure leads to healthy manpower. And, healthy manpower ensures higher efficiency in production of goods and services.
Health Issues
Meeting the challenges of health infrastructure challenges is a tough one for India.
Major health-related issues that India has been facing since independence are −
Medical education,
Research and development for the medicines,
Adulteration of drugs or duplicate poisonous drugs,
Scarcity of medical professionals, etc.
Poor infrastructure (such as scarcity of hospitals, medicines, doctors, medical equipment, etc.)
In India, about 70% of the hospitals and 60% of the dispensaries are being run by the private sector.
They provide treatment to 80% out-patients and 46% in-patients.
The Government has implemented various healthcare policies and programs to overcome the health-related issues but, there is still a long way to go.
Indian Systems of Medicine
Indian System of Medicine (ISM) − The ISM integrates six systems of treatment under it. They are as follows −
- Ayurveda
- Yoga
- Siddha
- Unani
- Naturopathy
- Homeopathy
Other Facts
Medical infrastructure in India is poorly developed; there is a lack of funds as well as will-power to invest in the research and development of medicines.
Currently, there are about 7 lakh registered practitioners, 3167 ISM hospitals, and 26,000 dispensaries in India.
The health status of a country normally is evaluated on the basis of some indicators such as −
- Maternal mortality rates
- Infant mortality rate
- Life expectancy
- Nutritional level
In addition to these, current status of non-communicable and communicable diseases is also considered (to measure the health status).
Indian government expends about 8.2% of the total GDP on health sector, which is very low in comparison to other countries.
India has about 17% (population) of world’s total population, but unfortunately, it bears about 20% of global burden of diseases (GBD).
GBD is an indicator that measures the number of people who are dying prematurely because of a particular disease. It also considers the number of years they spent in a state of ‘disability’ (owing to the disease).
In India, maximum number of people die because of communicable diseases like malaria, diarrhoea, and tuberculosis.
About 5 lakh children die because of water-borne diseases.
2.2 million children die because of poor supply of vaccines and malnutrition.
Though about 70% of the Indian population lives in rural area, rural areas account to only one-fifth of the total hospitals (collectively private and public).
There are only 0.36 hospitals per one lakh people, whereas urban areas have 3.6 hospitals per one lakh people. This figure is comparatively better, but even this is poor on an overall basis.
20% of the poorest people in India, spend about 12% of their income on healthcare, whereas the rich people spend merely 2% of their income on healthcare.
There is a great disparity between women’s health and men’s health.
Women suffer many health problems and because of lack of health care systems, most of them are left at god’s mercy.
The discrimination between male child and female child is another big issue; this is the reason behind a very low sex ratio — 940 females /1000 males (2011 census), and 927 females/1000 males (2001 census).
More than 50% of married women aged between 15 and 49 suffer from the problem of anaemia and other nutritional problems. Surprisingly, this is the reason for 19% of maternal deaths.
Abortions (especially of girl child) are also a major cause of maternal deaths in India.
As discussed above, health of people is the symbol of nation’s growth. In addition to this, a better health is the right of every person that need to be taken care of in a proper manner.
The Following Table illustrates Share of Commercial Energy Consumption (in %) −
| Sector | 1953-54 | 1970-71 | 1990-91 | 2012-13 |
|---|---|---|---|---|
| Household | 10 | 12 | 12 | 22 |
| Agriculture | 1 | 3 | 08 | 18 |
| Transport | 44 | 28 | 22 | 02 |
| Industry | 40 | 50 | 45 | 45 |
| Others | 05 | 07 | 13 | 13 |
The Following Table illustrates Public Health Infrastructure in India −
| Items | 1951 | 1981 | 2000 | 2013-14 |
|---|---|---|---|---|
| Hospital | 2,694 | 6,805 | 15,888 | 19,817 |
| Beds | 1,17,000 | 5,04,538 | 7,19,860 | 6,28,708 |
| Dispensaries | 6,600 | 16,745 | 23,065 | 24,392 |
| PHCs | 725 | 9,115 | 22,843 | 24,448 |
| Sub-centres | - | 84,735 | 1,37,311 | 1,51,684 |
The Following Table illustrates Health status of India in Comparison to Other Countries (2012) −
| Indicators | India | China | USA |
|---|---|---|---|
| Infant Mortality Rate/1,000 live births | 44 | 12 | 6 |
| Birth by Skilled Attendants (% of total) | 67 | 96 | 99 |
| Fully Immunised | 72 | 99 | 99 |
| Health Expenditure as % of GDP | 3.9 | 5.1 | 17.7 |
| Govt. Health Spending to total Govt. Spending (%) | 8.2 | 12.5 | 20.3 |
| Private Expenditure on Health (%) | 86 | 79 | 22 |
Indian Economy - Rural Development
Introduction
About two-third of the total population in India lives in villages; so, integrated rural development will lead to the nation’s development.
Credit and Marketing in Rural Areas
In 1969, Indian government adopted social banking and multi-agency approach to meet the requirements of rural credit.
In 1982, the National Bank for Agriculture and Rural Development (NBARD) was established as the supreme body to administer financial activities of rural areas.
Later on many schemes and other commercial banks, regional rural banks, and cooperatives and land development banks came up for the rural credit at cheaper rate.
Self Help Groups (SHG) are also doing good job towards the betterment of the rural people.
The SHGs disburse micro-credits to the rural people under the Micro-Credit Programme.
Agricultural Marketing System
The agricultural marketing system and different agricultural commodities are assembled, stored, processed, packaged, transported, graded, and distributed to various parts of the country.
In recent years, various alternate marketing channels emerged under which farmers directly sell their products to consumers and make more incomes. For example −
Apni Mandi covering the areas of Punjab, Haryana, and Rajasthan.
Hadaspar Mandi covering the areas of Pune.
Rythu Bazars covering the areas of Andhra Pradesh and Telangana (it is especially for fruits and vegetables).
Uzhavar Sandies covering the areas of Tamil Nadu.
In addition to all these (discussed above), many fast food chains are also being run.
Diversification into Productive Activities
Many people believe that dependency on one occupation is risky; therefore, the concept of diversification is introduced with an objective to provide consistent means of subsistence and sustainable development.
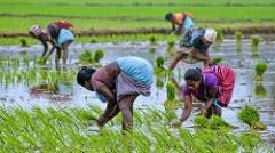
Along with agriculture, other activities such as livestock farming, poultry and fisheries were introduced.
Under the ‘Operation Flood’, farmers can pool their milk produce according to different grading (based on quality) and the same is processed and marketed to urban centres.
Fisheries
The development of fisheries has come a long way in India. Fisheries is further categorized into inland water fisheries (accounts 64%) and marine fisheries (accounts 36%).
Fisheries account to 0.8% of the total GDP.
Andhra Pradesh, West Bengal, Kerala, Gujarat, Maharashtra, and Tamil Nadu are major fish producers.
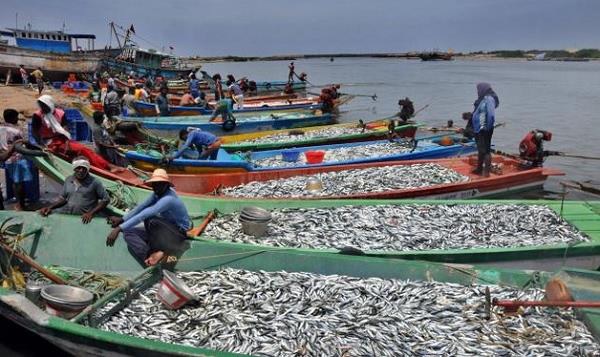
Fishermen are facing many problems, among which poverty and illiteracy are the most common ones.
Horticulture
Cultivation of medicinal plants, fruits, vegetables, nuts, seeds, herbs, sprouts, mushrooms, algae, flowers, seaweeds and non-food crops such as grass and ornamental trees and plants is known as Horticulture.
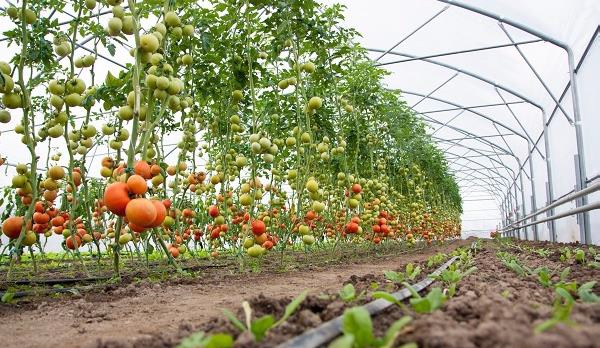
Horticulture plays a significant role in Indian economy and contribute about 6% to the country’s GDP.
India is the second largest producer of fruits and vegetables in the world.
Organic Farming
In the recent years, campaigns and awareness programmes have been conducted to make the people aware of the devastating impacts of fertilizers and chemicals. People have now started supporting and promoting organic farming. The benefits of organic farming are as follows −
It restores the fertility of soil.
It maintains the food’s original taste and nutritional values.
It does not harm nature.
It enhances the ecological balance.
Though organic farming comes with its own drawbacks, but it has more advantages in the domestic as well as in the international markets, as it is produces heathy food and is a well-accepted means of sustainable development.
Major Problems
There are some major obstacles that come on the way of rural development. They prove to obstruct the developmental process. The obstacles are as follows −
Literacy (especially female literacy needs to be given additional attention)
Vocational training programs
Public health
Sanitation
Land reforms
Development of infrastructure including road, electricity, irrigation, marketing facilities, agricultural advancement and research, etc.
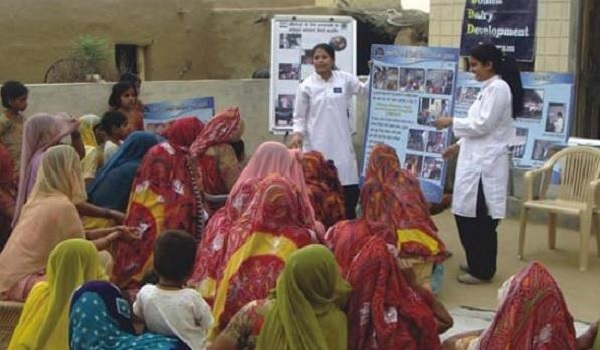
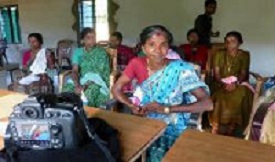
The Poor Women’s Bank − In Kerala, a small savings bank for poor women was started under the Kudumbashree movement – which is a women-oriented community-based poverty reduction program.
This bank was set up in 1995 with the objective to encourage the habit of saving among poor women. In no time, it became the largest informal bank operating in Asia in terms of participation by the women and the savings mobilised. Tamil Nadu Women in Agriculture(TANWA)
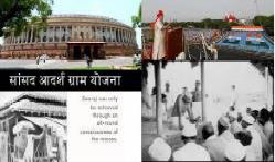
TANWA is a project started in Tamil Nadu with the objective to train women in the latest agricultural techniques. Saansad Adarsh Gram Yojana(SAGY)
In October 2014, Government of India introduced a scheme — SAGY, under which parliamentarians need to identify and select one village from his/her constitution (not belongs to his/her spouse) and develop it as a model village.
Indian Economy - Money and Banking
Introduction
Money is a commonly accepted medium of exchange.
Economic exchanges without the arbitration of money are called barter exchanges.
Barter exchanges become extremely difficult in large economies because of the high costs people would have to incur looking for suitable persons to exchange their surpluses with.
Money also acts as a convenient unit of account. The value of all goods and services can be expressed in monetary units.

Money is not perishable and its storage costs are also considerably lower. It is also acceptable to anyone at any point of time. Thus money can act as a store of value for individuals.
Any asset other than money can also act as a store of value. For example, real estate, precious metals, livestock, stock, etc.
There are mainly two main reasons why people want to hold money. The reasons are as follows −
- Transaction motive
- Speculative motive
Bonds are papers bearing the promise of a future stream of monetary returns over a certain period of time.
Speculative demand for money is inversely related to the rate of interest.
If supply of money in the economy increases and people purchase bonds with this extra money, then −
- Demand for bonds will go up
- Bond prices will rise, and
- Rate of interest will decline
Forms of Money
The balance in savings and deposits in current account, held by the public in commercial banks is also considered money. These deposits are called demand deposit.
Deposits which are fixed for a particular period of time and can only be drawn at the time of maturity are known as time deposits.
Every currency note bears on its face a promise from the Governor of RBI that if someone produces the note to RBI, or any other commercial bank, RBI will be responsible for giving the person purchasing power equal to the value printed on the note and coin.
Currency notes and coins are called fiat money. They do not have intrinsic value like a gold or a silver coin. They are also called legal tenders as they cannot be refused by any citizen of the country for settlement of any kind of transaction.
Demand deposits (cheques) can be refused by anyone as a mode of payment. They are not legal tenders.
Reserve Bank of India
RBI not only acts as a banker to the commercial banks. It also acts as a banker to the government of India and the state government.
In India, the currency notes are issued by the Reserve Bank of India (RBI), which is the monetary authority in India; however, the coins are issued by the Government of India.
When RBI purchase or sell government securities to the general public in a bid to increase or decrease the stock of high powered money in the economy is called Open Market Operation.
Bank rate is the rate of interest on which RBI lent money to the commercial bank at the time of shortage of reserves.
If the rate of Cash Reserve Ratio (CRR) and Statutory Liquid Ratio (SLR) increases or decreases, then it leads to a decrease or an increase the value of the money multiplier and money supply in the economy.
Money Supply
The total stock of money in circulation among the public at a particular point of time is called money supply.
According to RBI, there are four alternative measures of money supply known as M1, M2, M3 and M4.
M1 = CU + DD
CU refers to the currency held by the public and DD refers to the net demand deposits held by commercial banks.
M2 = M1 + Post Office Savings Deposits.
M3 = M1 + Time Deposits with commercial banks.
M4 = M3 + Total deposits with Post Office savings organisations (excluding National Savings Certificates).
M1 and M2 are called narrow money and M3 and M4 are called broad money.
M3 is the most commonly used measure of money supply. It is also known as aggregate monetary resources.
Money supply will change if the value of any of its components such as CU, DD or Time Deposits changes.
Other Facts
The Currency Deposit Ratio (CDR) is the ratio of money held by the public in currency to that they hold in bank deposits.
The Reserve Deposit Ratio (RDR) is the proportion of the total deposits commercial banks keeps as reserves.
The Cash Reserve Ratio (CRR) is the deposits that banks must maintain with the RBI.
The Statutory Liquidity Ratio (SLR) requires the banks to maintain a given fraction of their total demand and time deposits in the form of specified liquid assets.
Commercial banks can borrow money from RBI at bank rate when they run short of reserves. High bank rates make borrowing from RBI a costly affair.
The rate of interest offered by the bank to deposit holders is called the borrowing rate and the rate at which banks lend out their reserves to investors is called the lending rate.
The difference between borrowing rate and lending rate is called spread.
The creditworthiness of a person is judged by his/her current assets or the collateral (a security pledged for the repayment of a loan) he/ she can offer.
The total liability of the monetary authority of the country, RBI, is called the monetary base or high powered money.
High powered money then consists of currency held by the public and reserves of the commercial banks, which include vault cash and banks’ deposits with RBI.
The total amount of deposits held by all commercial banks in the country is much larger than the total size of their reserves. If all the account-holders of all commercial banks in the country want their deposits back at the same time, the banks will not have enough means to satisfy the need of every account-holder and there will be bank failures.
In a mixed economy, Government plays an important role.
On certain things, the government has an exclusive right, such as national defence, roads, government administration, etc. (these are known as public goods).
Government’s allocation function relates to the provision of public goods and services by agencies of the government.
Through its tax and expenditure policy, government attempts to bring about a distribution of personal income of households in a manner that is considered just and fair. It taxes the rich and designs schemes which benefits the poor.
According to the Article 112 of the Indian Constitution, the Government at the centre needs to present annual financial statement before the Parliament. It is a statement of estimated receipts and expenditures of the Government of India in respect of each financial year, which runs from 1 April to 31 March.
The Annual Financial Statement is also the main Budget document and is commonly referred to as the Budget Statement. The different types of budgets included in this are as follows −
- Revenue Budget
- Capital Budget
The Revenue Budget illustrates the −
The Revenue (current) receipts (of the government) and
The Revenue expenditure (that can be met from these receipts).
Indian Economy - Government Budget
Introduction
Annual Financial Statement
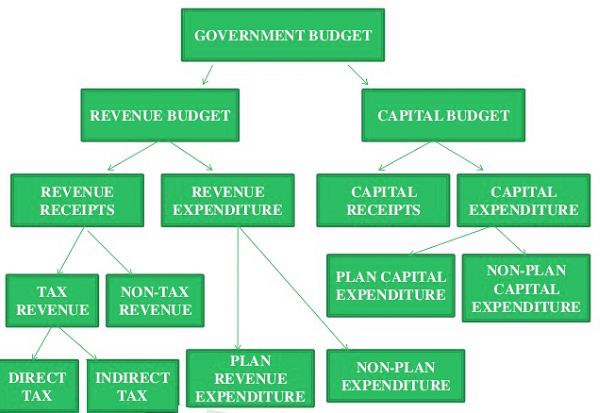
Revenue Budget
Revenue Receipts
Revenue receipts are receipts of the government which are non-redeemable, i.e., they cannot be reclaimed from the government.
Revenue receipts are categorized as −
Tax Revenue.
Non-tax Revenues.
Tax revenues consist of the proceeds of the taxes and other duties levied by the central government.
Tax revenues are further classified into direct taxes (levied directly from the individuals as income tax) and indirect taxes (levied on goods and products within the country).
Corporation tax contributes the largest share in revenue receipts, followed by income tax.
Non-tax revenue of the central government largely comprises of −
Interest receipts on account of loans by the central government.
Dividends and profits on investments made by the government.
Fees and other receipts for services rendered by the government.
Cash grants-in-aid from foreign countries and international organizations.
Revenue Expenditure
On the other hand, Revenue Expenditure largely includes −
The expenses incurred for the normal functioning of the government departments and various services.
Interest payments on debt incurred by the government.
Grants those are given to the state governments and other parties.
Budget documents classify total expenditure into plan and non-plan expenditure.
The plan revenue expenditure includes the central Plans (the Five-Year Plans) and central assistance for State and Union Territory plans.
Non-plan expenditure includes interest payments, defence services, subsidies, salaries, and pensions.
Subsidies are important policy instruments, destined to promote welfare in the society.
Capital Budget
The Capital Budget is an account of the assets as well as liabilities of the central government; it takes into consideration changes in capital.
The capital account is further categorized as follows −
- Capital Receipts
- Capital Expenditure (of the government).
Capital Receipts
Capital Receipts include all those receipts of the government, which create liability or reduce financial assets.
Main items of capital account are loans raised by the government from −
The public, which is known as market borrowings.
From the Reserve Bank and commercial banks.
Other financial institutions through the sale of treasury bills.
Loans received from the foreign governments and the international organizations.
Recoveries of the loans granted by the central government.
Some other items of capital account are −
Small savings – such as Post-Office Savings Accounts, National Savings Certificates, etc.)
Provident funds and net receipts obtained from the sale of shares in Public Sector Undertakings (PSUs.
Capital Expenditure
Capital Expenditure includes the expenditures of the government, which result in the creation of physical or financial assets or reduction in financial liabilities.
Examples of capital expenditure are as follows −
Acquisition of land, building, machinery, equipment, investment in shares, and
Loans and advances by the central government to the governments of state and union territory, PSUs and other parties.
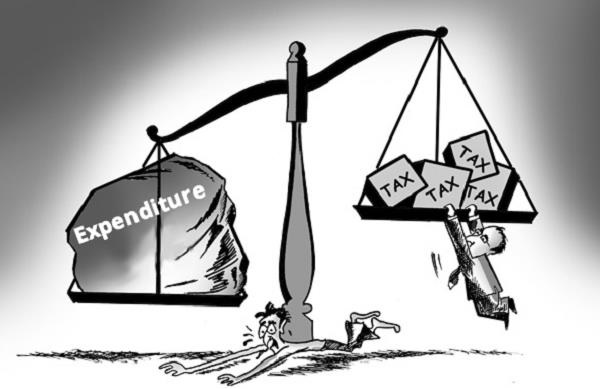
Budget Deficit
When a government spends more than it receives by the way of revenue, it is known as the budget deficit.
The difference between revenue expenditure and revenue receipts is known as the revenue deficit.
The difference between the government’s total expenditure and its total receipts excluding borrowing is known as the fiscal deficit.
The growth of revenue deficit as a percentage of fiscal deficit points to a deterioration in the quality of government expenditure involving lower capital formation.
Government deficit can be reduced by an increase in taxes or/and reduction in expenditure.
Public debt is burdensome if it reduces the future growth in terms of output.
Indian Economy - Consumer Rights
Introduction
All of us are consumers, as all of us go to the market and purchase products; this is irrespective of the fact that we buy salt for Rs. 20 or a smart television for Rs. 50,000.
It is legal as well as moral duty of sellers to provide quality products to their consumers and, it is the right of the consumer to buy products of good quality.
Various laws, rules, and regulations have been put into practice to protect consumer rights.
Providing bad, tampered, adulterated, or duplicate product is a violation of consumer rights. This may lead to legal action and the seller/producer may have to pay a huge compensation amount.
Consumer Movements
The consumer movement in India as a ‘social force’ originated with the necessity to protect and promote the interests of consumers against the unethical and unfair trade practices. This movement aims to fight bad practices such as −
- Rampant food shortages.
- Black marketing.
- Adulteration of food and edible oil.
- Hoarding, etc.
The consumer rights were legally recognized after the enactment of the Consumer Protection Act, (COPRA) of 1986 by the Government of India.
Consumer’s Right
COPRA governs all business conducts and ensures consumer’s rights.
If a producer/seller acts wrongly and causes harm to any consumer, then the consumer can exercise his right to ask for compensation. And, if the seller is not ready to pay the compensation amount, the aggrieved consumer can file a lawsuit in consumer’s court.
As per the law, all producers and sellers are liable to provide all details of respective products. For example, on a medicine bottle, you can find the manufacturing date, the composition, manufacture’s details, expiry date, etc. (as shown in the image given below).
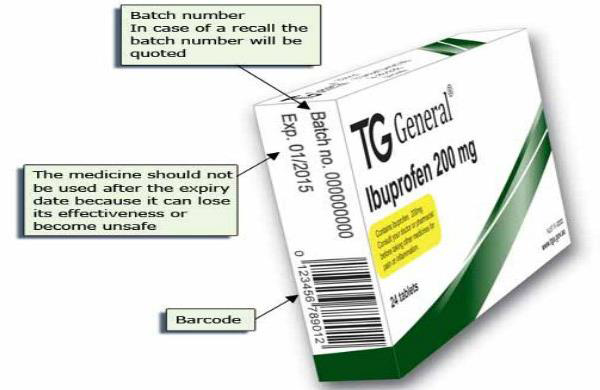
It is consumers’ right to have this information (right to be informed) of the product that they are buying.
If a consumer finds that the medicine, he has been given by a chemist is already beyond the expiry date or is a duplicate one, then he can take legal action against the medicine seller.
Government of India enacted the Right to Information (RTI) Act in 2005 to ensure citizen’s access to public information.
Right to Information Act is a comprehensive set of rules and guidelines that ensure and provide all the (asked/required) information to the (respective) citizens about the functioning of the government departments.
It is the duty of the respective department (where you put query) to provide the required information (that you asked) with a specific timeline; they cannot ignore your query.
Consumer’s Court
The place you can file a case for redressal of consumer dispute are categorized into three levels −
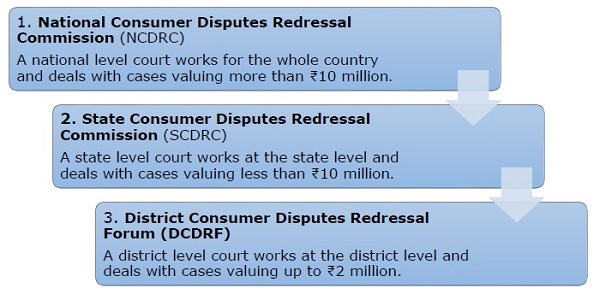
If your case is valued at less than 2 million and you are not satisfied with the DCDRF’s judgment; you can further appeal to the state level court and so on.
As a consumer, you have to be well informed about your rights; for that you need to acquire the knowledge and skill and become a well-informed consumer.
24 December of every year is observed as ‘National Consumers’ Day’ as Consumer Protection Act of 1986 was enacted on this date.
Problems
In spite of so many years of COPRA enactment, lakhs of people are not able to exercise their consumer rights; they are being exploited.
Many of the consumers have no idea about their (consumer) right, but there are also many other reasons, such as corruption, faulty practices, negligence by the consumer, etc.
On the other hand, at many places neither sellers give memo (receipt) of purchased goods nor do buyers (consumers) ask for that; receipt supports the lawsuit.
It is indispensable to have the purchase receipt to file a lawsuit; it is a must to ask for the correct purchase receipt whenever you buy something.
To overcome the situation, consumers need to update themselves and participate and fight for their rights.
As a responsible consumer, one should also make others aware; this is the best way to spread the awareness among the masses.
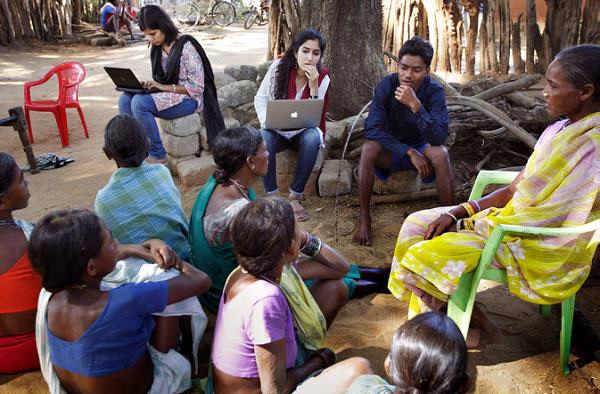
Indian Economy - Reforms
Introduction
1991 was a landmark year in the history of Indian economy. There was a tectonic shift in the Indian economic policy (during this year).
In 1991, India suffered great economic crisis, which was uncontrollable, the condition was worsening gradually; resultantly, the inflation of the prices of daily use commodities hit the people hard.
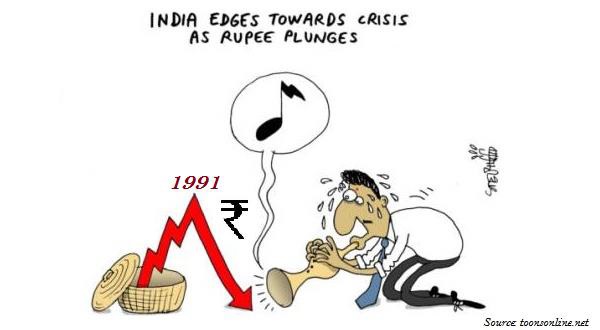
As the foreign currency reserves went down, the balance of payment crisis was a major challenge for the country to deal with.
The reason for this crisis was long standing decline in exports, since 1980. When we import some product (such as petroleum), we need to pay in dollars, which we earn through export of our products.
On the other hand, government’s income was inadequate to address the issue; the revenue that the Government generated through taxation was inadequate.
India borrowed a loan of $7 Billion from the International Bank for Reconstruction and Development (IBRD), i.e., the World Bank and the International Monetary Fund (IMF), on the condition to liberalise the economic policy and open doors for international trade in India.
Liberalization
The period from the late 1980s to now witnessed significant reforms. The reforms can be categorized into two groups −
- Stabilisation measures.
- Structural reform policies.
Stabilisation measures are short-term in nature and attempt to control the crisis situation by maintaining sufficient foreign exchange reserves.
Structural reform policies are long-term policies that attempt to improve the overall economic condition by increasing the international competitiveness and removing the rigidities and other restraining obstacles.
Under the liberalisation policy of 1991, there were many changes in the areas of licensing and procedures, import of technology, import of capital goods coupled with a reasonable rate of public investment and almost total protection to domestic industries from international competition through quantitative restrictions on imports as well as high tariff rates.
The industrial licensing system was almost abolished except for some industries such as cigarettes, alcohol, hazardous chemicals, electronics, aerospace, drugs and pharmaceuticals and industrial explosives.
Particular industries such as the defence equipment, atomic energy generation, and railway are kept exclusively under the public sector.
There are some industries that have been provided the liberty to fix the prices for their products by the government.
Financial sector, which includes banks, stock exchange operations, and foreign exchange market were to be regulated and controlled by Reserve Bank of India (RBI), but the policy brought in a change, wherein, many of the financial institutions have been given liberty to take NOT ALL, but some major financial decisions on their own.
Many Foreign Institutional Investors (FII) including merchant bankers, pension funds, mutual funds, etc. are allowed to invest in the Indian financial market.
Tax policies and public expenditure policies are collectively known as fiscal policy.
Tax is categorized into two parts — Direct Tax and Indirect Tax.
Direct taxes are taxes collected on the income of individuals as well as business enterprises. After liberalization, the share of direct tax is coming down.
Taxes levied on goods and commodities are known as indirect tax.
Foreign exchange market has also been reformed and this helps to resolve the crisis of balance of payments.
Trade and investment policy reforms increased the international competitiveness of the industrial sector.
To protect domestic products and industries, the government used to impose quantitative restrictions on imports by keeping the tariffs very high. This policy has also underwent reforms now.
Import licensing was removed; however, it remained active for the hazardous and environmentally sensitive industries.
Quantitative restrictions have been completely abolished from April 2001.
Export duties have also been removed to increase the competitive position of Indian goods in the international market.
Privatisation
Privatisation means opening the doors of the sectors and industries which were once preserved for the government. This also includes selling the government-owned enterprises to private companies.
Government companies transformed into private companies either by −
Government’s withdrawal from the ownership and management, or,
Selling the public sector companies to private companies.
Selling a part of the equity of government enterprises to the public is called Disinvestment.
Besides, to improve the efficiency of certain public sector industries, government has vested on them, the autonomy to take managerial decisions. And, some of the industries, which are highly regarded have been awarded the status of Maharatnas, Navratnas, and Miniratnas.
Maharatnas include Indian Oil Corporation Limited and Steel Authority of India Limited.
Navratnas include Hindustan Aeronautics Limited and Mahanagar Telephone Nigam Limited.
Miniratnas include Bharat Sanchar Nigam Limited, Airport Authority of India, and Indian Railway Catering and Tourism Corporation Limited.
Globalisation
Globalisation is a complex phenomenon, which was a result of the integration of world economy and trade interdependence.
Because of advanced development of information technology, many of the services now are getting outsourced. For example −
- Business Process Outsourcing (BPO)
- Voice-based business process
- Record keeping
- Banking services
- Accountancy
- Film editing
- Music recording
- Book writing
- Research and editing, etc.

Globalization helped to promote many Indian companies in the international market. It led to Indian companies opening their branches in different countries of the world. For example, ONGC Videsh operates in 16 countries, Tata Steel operates in 26 countries, HCL in 31 countries.
World Trade Organization (WTO)
WTO was established in 1995.
It was preceded by GATT (General Agreement on Trade and Tariff), which was established in 1948, which had 23 member countries participating in it.
It was a multilateral trade agreement established with the objective to offer equal opportunity to all countries in the international market for the trading.
WTO agreement covers goods as well as services and intended to provide equal opportunity to all by removing the various tariff rates (in different countries) and non-tariff barriers.
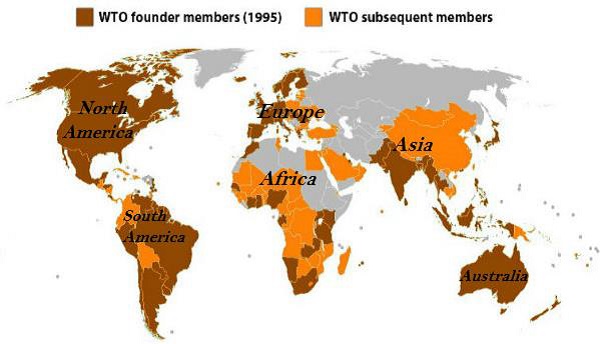
As a member of WTO, India also follows the WTO’s agreements.
After the Reform Period
After the reform of 1991, agriculture sector witnessed a decline; there was a fluctuation in the industrial sector, and the service sector experienced a significant growth.
Foreign Direct Investment (FDI) and Foreign Institutional Investment (FII) have increased from about USD 100 million (in 1990-91) to USD 467 (billion in 2012-13).
Though under the policy of globalisation, international market is open for all and there are equal opportunities for all; however, some economists are of the opinion that it is more beneficial for the developed countries.
Local industries of developing countries are also facing lot of problems, as they now have to compete with the companies in foreign countries.
Developing countries still have no access to developed countries’ local markets.
Indian government since 1991, sets the amount of disinvestment target every year; in 2013-14, the target was about Rs. 56,000 Crores and it has achieved target of only about Rs. 26,000 Crores.
Siricilla Tragedy − Power sector reforms has increased the power tariff, which has badly affected the workers working especially in small scale industries.
For example, Siricilla, a town in Telangana is widely known for its power loom textile industry. Here, wages of workers are directly linked with the amount of production. In such situations, power cuts have direct impact on workers’ wage. This often leads to the workers committing suicides.

Indian Economy - Open
Introduction
In the modern world, most of the economies are ‘Open Economy’ because of the three following reasons −
Market Linkage − It means consumers and firms both have the opportunity to choose between domestic and foreign goods.
Financial Market Linkage − It means investors have the opportunity to choose between domestic and foreign assets.
Factor Market Linkage − It means firms can choose where to locate production and workers can choose where to work.
Total foreign trade (i.e., exports + imports) as a proportion of GDP is a common measure of the degree of openness of an economy.
Features of Open Economy
Every country has its own currency and in the international market, there are hundreds of currencies with different values; hence, the International Monetary System has been set up to handle these issues and ensure stability in international transactions.
The Balance of Payments (BoP) keep a record of the transactions in goods, services, and assets between residents of a country and with the rest of the world for a given period (typically a year).
The Current Account records exports and imports of goods and services and transfer payments.
When exports are greater than imports, it is known as trade surplus and when imports are greater than exports, it is known as trade deficit and the balance of exports and imports of goods is known as the trade balance.
Exchange rate is the rate at which one currency is exchanged with the other.
Bilateral nominal exchange rates refer to exchange rates for one currency against another and they are nominal because they quote the exchange rate in terms of money, for example, one pound or dollar is equal to many rupees.
The real exchange rate is often considered as a measure of a country’s international competitiveness.
In a system of flexible exchange rates (also called floating exchange rates), the exchange rate is determined by the forces of market — demand and supply.
Changes in the price of foreign exchange under the flexible exchange rates are referred to as currency depreciation or currency appreciation.
Managed Floating Exchange Rate System is a mixture of a flexible exchange rate system (the float part) and a fixed rate system (the managed part).
Managed Floating Exchange Rate System, also known as dirty floating, is the system under which central banks intervene to buy and sell foreign currencies in an attempt to moderate exchange rate movements whenever they feel that such actions are appropriate. Official reserve transactions are, therefore, not equal to zero.
Gold Standard System
Under the Gold Standard system, each participant country is committed to guarantee the free convertibility of its currency into gold at a fixed price, which means that the residents have, at their disposal, a domestic currency which is freely convertible at a fixed price into another asset (gold) acceptable for all international payments.
The gold standard system made it possible for each currency to be convertible into any other currency at a fixed price.
In 1967, gold was removed by creating the Special Drawing Rights (SDRs) (also called as ‘paper gold’), in the IMF with the purpose to increase the stock of international reserves.
Close Economy Vs Open Economy
In a closed economy, there are three sources of demand for domestic goods. The sources are as follows −
- Consumption (C)
- Government spending (G)
- Domestic investment (I)
Closed economy = C + G + I.
On the other hand, in an open economy, exports and imports are the additional elements, considered to measure the economy.
An increase in foreign income leads to increased exports. This thereby increases domestic output and improves the trade balance.
Indian Economy - Micro Economics
Introduction
Needs are the basic items required for human survival. And, goods and services are produced to satisfy those basic needs. Every individual in one or the other way is engaged in the production of goods and services.
As resources are limited; therefore, allocation of the resources and the distribution of the final mix of goods and services are the basic economic problems of our society.
The basic economic activities of our society are production, exchange, and consumptions of goods and services.
If production does not meet the demand, it leads to scarcity.
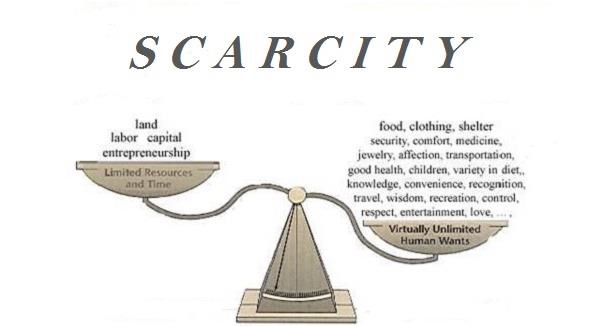
These problems can be solved either by a personal discussion with the individual (whose demands need to be fulfilled) as done in the market or by a planned approach initiated by the central authority, i.e., the government at the center.
Types of Economy
Based on the characteristics, an economy is divided into two types. They are −
- Centrally planned economy
- Market economy
In a centrally planned economy, the government or the central authority plans and makes decisions regarding all the important activities in the economy.
On the other hand, in the market economy, all the economic activities are planned and organized by the market.
Market in economics is an institution that facilitates people free interaction and ensures the economic activities run smoothly. So, market is basically a center where people can exchange their products with each other.
In economics, market is a place that regulates and manages the demand and prices of goods. For example, as the demand for product rises, prices of that product also rises.
In the present world, most of the countries have mixed economies; it is an economic system with a mixture of economic planning with government intervention and market. Here, the government intervenes and makes important decisions. Markets are given partial liberty to make decisions, which would benefit the market and the economy.
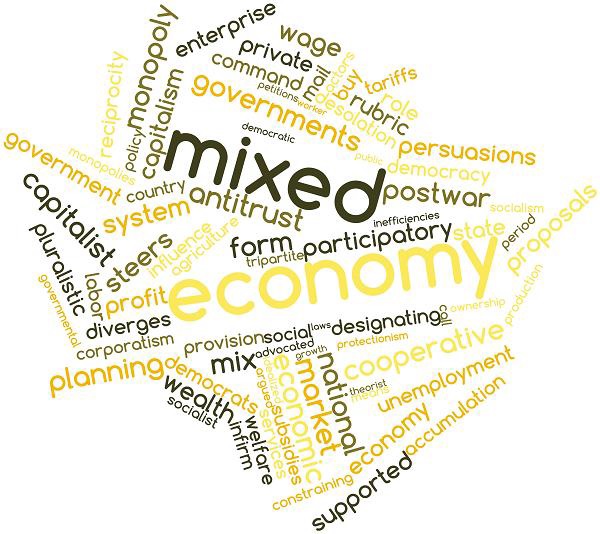
India accepted the policy of mixed economy after independence. In 1948, India declared itself a mixed economy for the very first time.
Positive economic analysis describes how the different mechanisms of an economy work.
Normative economic analysis is the study of what economic mechanism should be adopted in order to achieve a particular goal.
Economics is broadly categorized into two groups. They are −
- Microeconomics
- Macroeconomics
Microeconomics largely describes the behavior of individual economic agents in the markets for different goods and services and tries to figure out how prices and quantities of goods and services are determined through the interaction of different individuals in the markets.
Major questions answered in Microeconomics are −
What is the level of total output in the economy?
How is the total output determined?
How does the total output grow over time?
Are the resources of the economy (e.g. labor) fully employed?
What are the reasons behind the unemployment of resources?
Why do prices rise?
On the other hand, Macroeconomics describes the economy as a whole by focusing on aggregate measures, such as total output, employment, and aggregate price level.
Indian Economy - Macro Economics
Introduction
Macroeconomics is a broader concept; it talks about the whole economics of the country. For example −
- Growth of GDP
- Total production of cereals in India
- Total export in 2014
- Unemployment
- Inflation etc
In the economy of a country, the output level of all the goods and services in the company have a tendency to move together. For example, if output of food grain is experiencing a growth, it is generally accompanied by a rise in the output level of industrial goods.
The prices of different goods and services generally have a tendency to rise or fall simultaneously. We can also observe that the employment level in different production units also goes up or down together.
Macroeconomics simplifies the analysis of how the country’s total production and level of employment are related to attributes (called ‘variables’) such as prices, rate of interest, wage rates, profits and so on.
When these attributes start changing fast, like when prices are going up (in what is called an inflation), or employment and production levels are going down (heading for a depression), the general directions of the movements of these variables for all the individual commodities are usually of the same kind as are seen for the aggregates for the economy as a whole.
Types of Commodities
All kinds of the commodities in an economy are divided into three major parts −
- Agricultural goods
- Industrial goods
- Services
Further, Macroeconomics tries to analyse how the individual output levels, prices, and employment levels of these different goods get determined.
Economic Agents
Economic agents are those individuals or institutions who have an effect on the economy of a country. For example −
Consumers who decide how much to consume.
Producers who decide the production level.
Other agents like government, bank etc. who decide the different policies.
Adam Smith, the father of modern economics, had suggested that if the buyers and the sellers in each market take their decisions following only their own self-interest, economists will not need to think of the wealth and welfare of the country as a whole separately.
Macroeconomic policies are generally controlled and operated by the State itself or statutory bodies like the RBI, Securities Exchange Board of India (SEBI), etc.
According to John Maynard Keynes (the writer of ‘The General Theory of Employment Interest and Money’),
all the labours who are ready to work will be finding the employment and all the factories will be working at their full capacity
.The classical and traditional thinking (of Keynes) changed after the Great Depression of 1929.
The expenditure, which raises the production capacity of a firm or an enterprise is called investment expenditure.
Capitalist Economy
The characteristics of a Capitalist Economy are −
It is based on wage-labour and private ownership of the means of production.
Here, most of the inputs and outputs of production are supplied through the market (i.e. they are commodities) and essentially all production is in this mode.
The sale and purchase of labour service takes place at wage rate.
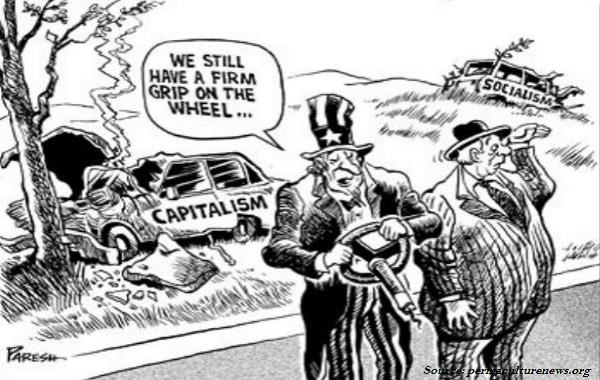
The capitalist country is that country in which production activities are mainly carried out by capitalist enterprises or several entrepreneurs.
Land, Labour, and Capital are the key factors of production in a capitalist economy.
Profit is the part of revenue, which is left with the entrepreneur after the payment of rent for land and building and wages to the labourers or workers.
Indian Economy - Sustainable Development
Introduction
The economic growth that a country and its people achieve over a period of time, is achieved at the cost of the environment.
Environment is badly damaged because of various economic activities — industrial activities, mining activities, and infrastructure development, etc.
Sustainable development is the need of the hour. It has the potential to address the challenges of the environment and also of the economy.
All biotic and abiotic factors collectively constitute environment.
All living organisms, such as animals, human beings, plants, birds, insects, and all other single cell and multi-cell organisms are biotic elements.
All other non-living things, such as air, water, land, etc. are abiotic elements.
Significance of Environment
Environment plays a significant role in every aspect of life. The contributions of the environment are varied: It provides resources (both renewable and non-renewable resources).
It has the capacity to assimilate wastes.
It provides diversity, essential for the sustenance of life.
It provides aesthetic services.
Environment has the carrying capacity, i.e., it re-generates some sorts of resources provided the rate of exploitation is lesser than the rate of re-generation; if the rate of exploitation increases, the resources get exhausted.
Environment has the capacity to expel impurities (various pollution in the environment); it has limited capacity (absorption capacity); hence, if the rate of pollution is more than the rate of purification, then it is a threat to the environment (i.e. environmental crisis)
Major Problems
The environmental crisis creates many problems such as depletion of Ozonelayer and Global Warming at the global level.
Environment has a major impact on the life and living of people; it may cause health issues, natural calamities (floods, earthquakes, droughts, etc.).
India has abundant natural resources (both renewable and non-renewable resources).
An exponential increase in population threatened led to over-exploitation of the natural resources which thereby threatened the environment.
Some problems with the exploitation of resources in India are −
- Water pollution
- Air pollution
- Land degradation
- Deforestation
- Desertification,
- Wildlife extinction, etc.
The per capita forest land in India is about 0.08 hectare, while the requirement is 0.47 hectare.
India has about 17% of the world’s total human population and 20% of the world’s total animal population, whereas, it has only 2.5% of world’s total geographical area.
The number of vehicles in India increased from 3 lakhs (in 1951) to 67 crores in 2003.
The use of motor vehicles is one of the major sources of air pollution in India.
The Central Pollution Control Board (CPCB) of India has identified 17 categories of polluting industries.
Environmental crisis also leads to economic crisis.
Global Warming
Global warming is a human-induced impact on the environment, under which the temperature of the lower atmosphere is increasing.
In the last two centuries, because of increasing industrial activities, burning of fossil fuels, deforestation, etc. emission of some of the greenhouse gasses (i.e. carbon dioxide, methane, CH4, etc.) have been increasing beyond the limit of environment’s absorbing capacity. The increased amount of greenhouses disrupted the cycle of heat budget; resultantly, the temperature of the lower atmosphere is increasing.
The major consequences of global warming are — melting of polar ice, sea level rise, coastal floods, extinction of various organisms, ecological imbalances, natural calamities, etc.
To arrest this alarming trend, international efforts have been made. The first attempt of that sort is the Kyoto Protocol, which was the result of the UN Conference held in Kyoto, Japan in 1997. The Kyoto Protocol set parameters to control the impacts of global warming by reducing the emission of greenhouse gases globally.
Ozone Depletion
Ozone depletion is the phenomenon of reduction of the ozone layer. Ozone layer is a Stratospheric layer of Ozone (O3) that filters the sun’s ultraviolet rays and protects us from many diseases including skin cancer, cataract, and sunburn.
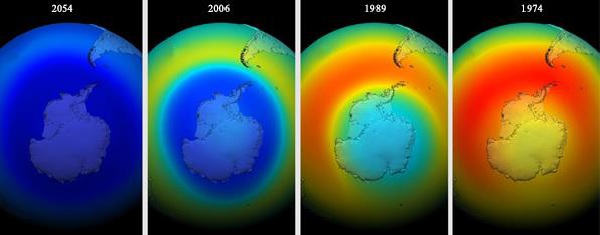
But because of the excessive emission of chlorofluorocarbons (CFCs), used as cooling substances in air-conditioners and refrigerators, or as aerosol propellants and bromofluorocarbons (halons), used as fire extinguishers, ozone layer is getting depleted (as shown in the above image – through a time period).
The Montreal Protocol was brought into existence to restrain the use of CFC compounds along other ozone depleting agents including carbon tetrachloride, trichloroethane (methyl chloroform), and halons (bromine compounds).
Sustainable Development
The notion of
Sustainable Development
was adopted by the United Nations Conference on Environment and Development (UNCED).Sustainable Development is defined as
the development that meets the needs of the present without compromising the ability of future generation to meet their own needs
.The Brundtland Commission suggested that meeting the needs of the future depends on how well we balance social, economic, and environmental objectives, or needs, when making decisions today.
Using the non-conventional sources of energy (such as Hydro power, wind power, geothermal energy, tidal power, etc.) is one the best strategies to protect the environment.
In rural India, a good number of people still use wood and other biomass products for cooking, and it has a great negative impact on the environment as the process involves cutting of trees; hence, providing them LPG as an alternative strategy would help save the environment.
Promoting the use of CNG for motor vehicles is another important alternative.
Solar power is very handy to use; a solar power plant can be established either for a single household and also for a big factory.
Promoting the use of traditional knowledge practices is also environmental friendly and also good for the human health.
Organic farming also needs to be promoted at large scale to improve the environmental condition, as conservation of the environment is the major objective of sustainable development.
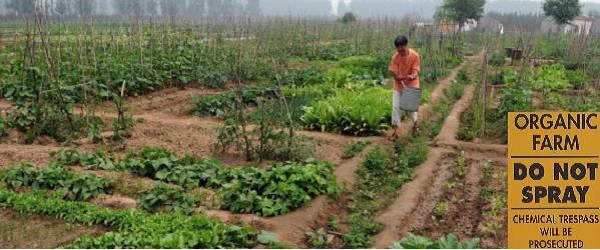
Pollution Control Boards − Central Pollution Control Board (CPCB), established in 1974, aims to address the environmental concerns especially, water and air pollution.
The CPCB is responsible to investigate, collect, and provide information related to water, air, and land pollution across the country. It also sets a standard for the sewage/trade effluent and emissions of various industrial pollutants.
Chipko or Appikco Movement
The meaning of Chipko is ‘to hug’. This movement was started A similar movement, known as ‘Appiko’, was started in Salkani jungle of Sirsi district of Karnataka (one of the southern states of India).