- GWT Highcharts Tutorial
- GWT Highcharts - Home
- GWT Highcharts - Overview
- Environment Setup
- Configuration Syntax
- GWT Highcharts - Line Charts
- GWT Highcharts - Area Charts
- GWT Highcharts - Bar Charts
- GWT Highcharts - Column Charts
- GWT Highcharts - Pie Charts
- GWT Highcharts - Scatter Chart
- GWT Highcharts - Dynamic Charts
- GWT Highcharts - Combinations
- GWT Highcharts - 3D Charts
- GWT Highcharts - Map Charts
- GWT Highcharts Useful Resources
- GWT Highcharts - Quick Guide
- GWT Highcharts - Useful Resources
- GWT Highcharts - Discussion
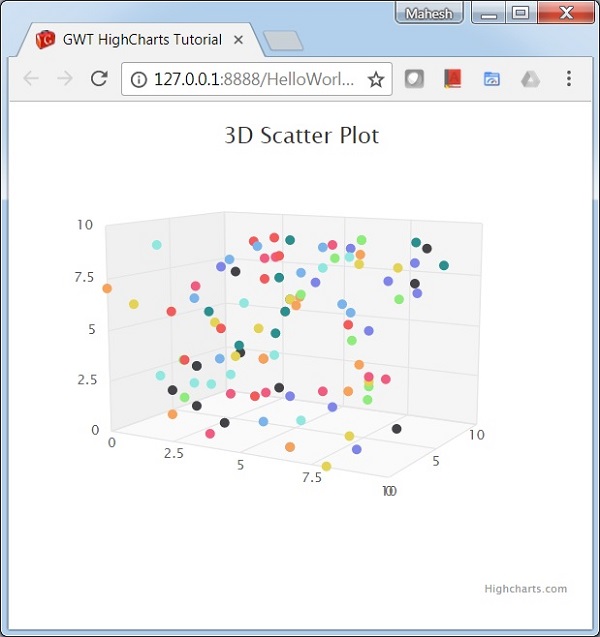
GWT Highcharts - 3D Scatter Chart
Following is an example of a 3D Scatter Chart.
We have already seen the configuration used to draw a chart in Highcharts Configuration Syntax chapter.
An example of a 3D Scatter Chart is given below.
Configurations
Let us now see the additional configurations/steps taken.
option3D
Configure the scatter chart type to be 3D based. Options3D sets the 3D options enabled.
chart.setOptions3D(new Options3D()
   .setEnabled(true)
   .setAlpha(10)
   .setBeta(30)
   .setDepth(250)
   .setViewDistance(5)
   .setFrame(new Frame()
      .setBottom(new FramePanel()
         .setSize(1)
         .setColor(new Color(0, 0, 0, 0.02))
      )
      .setBack(new FramePanel ()
         .setSize(1)
         .setColor(new Color(0, 0, 0, 0.04))
      )
      .setSide(new FramePanel()
         .setSize(1)
         .setColor(new Color(0, 0, 0, 0.06))
      )
   )
)
Example
HelloWorld.java
package com.tutorialspoint.client;

import org.moxieapps.gwt.highcharts.client.Chart;
import org.moxieapps.gwt.highcharts.client.Color;
import org.moxieapps.gwt.highcharts.client.Frame;
import org.moxieapps.gwt.highcharts.client.Frame.FramePanel;
import org.moxieapps.gwt.highcharts.client.Legend;
import org.moxieapps.gwt.highcharts.client.Options3D;
import org.moxieapps.gwt.highcharts.client.Series;

import com.google.gwt.core.client.EntryPoint;
import com.google.gwt.user.client.ui.RootPanel;

public class HelloWorld implements EntryPoint {
   public void onModuleLoad() {
      final Chart chart = new Chart()
         .setMarginBottom(100)
         .setMarginRight(50)
         .setType(Series.Type.SCATTER)
         .setOptions3D(new Options3D()
            .setEnabled(true)
            .setAlpha(10)
            .setBeta(30)
            .setDepth(250)
            .setViewDistance(5)
            .setFrame(new Frame()
               .setBottom(new FramePanel()
                  .setSize(1)
                  .setColor(new Color(0, 0, 0, 0.02))
               )
               .setBack(new FramePanel ()
                  .setSize(1)
                  .setColor(new Color(0, 0, 0, 0.04))
               )
               .setSide(new FramePanel()
                  .setSize(1)
                  .setColor(new Color(0, 0, 0, 0.06))
               )
            )
         )
         .setChartTitleText("3D Scatter Plot");

      chart.getYAxis()
         .setMin(0)
         .setMax(10)
         .setAxisTitle(null);

      chart.getXAxis()
         .setMin(0)
         .setMax(10)
         .setGridLineWidth(1);

      chart.getZAxis()
         .setMin(0)
         .setMax(10);

      chart.setLegend(new Legend()
         .setEnabled(false)
      );

      chart.addSeries(chart.createSeries()
         .setName("Reading")
         .setColorByPoint(true)
         .setPoints(new Number[][] {
            {1, 6, 5}, {8, 7, 9}, {1, 3, 4}, {4, 6, 8}, {5, 7, 7}, {6, 9, 6},
            {7, 0, 5}, {2, 3, 3}, {3, 9, 8}, {3, 6, 5}, {4, 9, 4}, {2, 3, 3},
            {6, 9, 9}, {0, 7, 0}, {7, 7, 9}, {7, 2, 9}, {0, 6, 2}, {4, 6, 7},
            {3, 7, 7}, {0, 1, 7}, {2, 8, 6}, {2, 3, 7}, {6, 4, 8}, {3, 5, 9},
            {7, 9, 5}, {3, 1, 7}, {4, 4, 2}, {3, 6, 2}, {3, 1, 6}, {6, 8, 5},
            {6, 6, 7}, {4, 1, 1}, {7, 2, 7}, {7, 7, 0}, {8, 8, 9}, {9, 4, 1},
            {8, 3, 4}, {9, 8, 9}, {3, 5, 3}, {0, 2, 4}, {6, 0, 2}, {2, 1, 3},
            {5, 8, 9}, {2, 1, 1}, {9, 7, 6}, {3, 0, 2}, {9, 9, 0}, {3, 4, 8},
            {2, 6, 1}, {8, 9, 2}, {7, 6, 5}, {6, 3, 1}, {9, 3, 1}, {8, 9, 3},
            {9, 1, 0}, {3, 8, 7}, {8, 0, 0}, {4, 9, 7}, {8, 6, 2}, {4, 3, 0},
            {2, 3, 5}, {9, 1, 4}, {1, 1, 4}, {6, 0, 2}, {6, 1, 6}, {3, 8, 8},
            {8, 8, 7}, {5, 5, 0}, {3, 9, 6}, {5, 4, 3}, {6, 8, 3}, {0, 1, 5},
            {6, 7, 3}, {8, 3, 2}, {3, 8, 3}, {2, 1, 6}, {4, 6, 7}, {8, 9, 9},
            {5, 4, 2}, {6, 1, 3}, {6, 9, 5}, {4, 8, 2}, {9, 7, 4}, {5, 4, 2},
            {9, 6, 1}, {2, 7, 3}, {4, 5, 4}, {6, 8, 1}, {3, 4, 0}, {2, 2, 6},
            {5, 1, 2}, {9, 9, 7}, {6, 9, 9}, {8, 4, 3}, {4, 1, 7}, {6, 2, 5},
            {0, 4, 9}, {3, 5, 9}, {6, 9, 1}, {1, 9, 2}
         })
      );

      RootPanel.get().add(chart);
   }
}
Result
Verify the result.
gwt_highcharts_3d_charts.htm
Advertisements