- ggplot2 Tutorial
- ggplot2 - Home
- ggplot2 - Introduction
- ggplot2 - Installation of R
- ggplot2 - Default Plot in R
- ggplot2 - Working with Axes
- ggplot2 - Working with Legends
- ggplot2 - Scatter Plots & Jitter Plots
- ggplot2 - Bar Plots & Histograms
- ggplot2 - Pie Charts
- ggplot2 - Marginal Plots
- ggplot2 - Bubble Plots & Count Charts
- ggplot2 - Diverging Charts
- ggplot2 - Themes
- ggplot2 - Multi Panel Plots
- ggplot2 - Multiple Plots
- ggplot2 - Background Colors
- ggplot2 - Time Series
- ggplot2 Useful Resources
- ggplot2 - Quick Guide
- ggplot2 - Useful Resources
- ggplot2 - Discussion
ggplot2 - Themes
In this chapter, we will focus on using customized theme which is used for changing the look and feel of workspace. We will use “ggthemes” package to understand the concept of theme management in workspace of R.
Let us implement following steps to use the required theme within mentioned dataset.
GGTHEMES
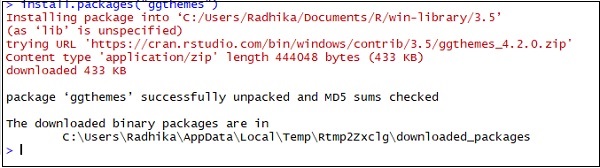
Install “ggthemes” package with the required package in R workspace.
> install.packages("ggthemes")
> Library(ggthemes)
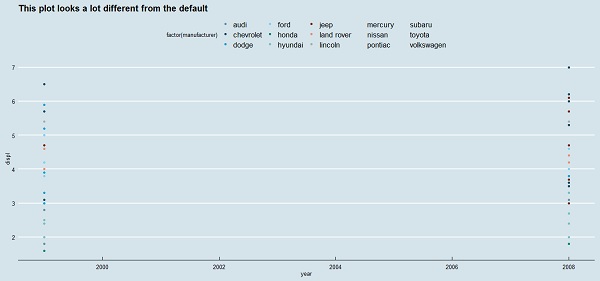
Implement new theme to generate legends of manufacturers with year of production and displacement.
> library(ggthemes)
> ggplot(mpg, aes(year, displ, color=factor(manufacturer)))+
+ geom_point()+ggtitle("This plot looks a lot different from the default")+
+ theme_economist()+scale_colour_economist()
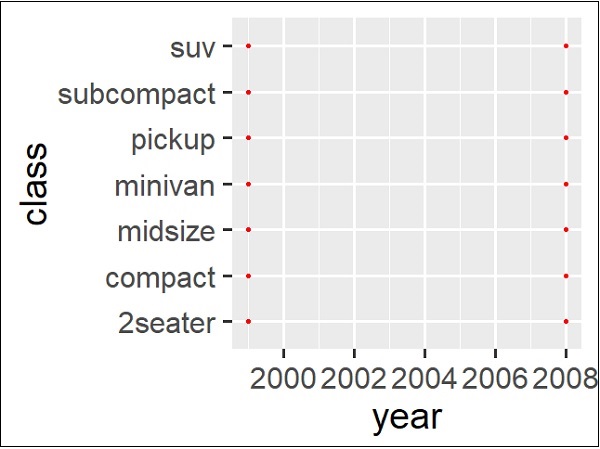
It can be observed that the default size of the tick text, legends and other elements are little small with previous theme management. It is incredibly easy to change the size of all the text elements at once. This can be done on creating a custom theme which we can observe in below step that the sizes of all the elements are relative (rel()) to the base_size.
> theme_set(theme_gray(base_size = 30))
> ggplot(mpg, aes(x=year, y=class))+geom_point(color="red")