- ggplot2 Tutorial
- ggplot2 - Home
- ggplot2 - Introduction
- ggplot2 - Installation of R
- ggplot2 - Default Plot in R
- ggplot2 - Working with Axes
- ggplot2 - Working with Legends
- ggplot2 - Scatter Plots & Jitter Plots
- ggplot2 - Bar Plots & Histograms
- ggplot2 - Pie Charts
- ggplot2 - Marginal Plots
- ggplot2 - Bubble Plots & Count Charts
- ggplot2 - Diverging Charts
- ggplot2 - Themes
- ggplot2 - Multi Panel Plots
- ggplot2 - Multiple Plots
- ggplot2 - Background Colors
- ggplot2 - Time Series
- ggplot2 Useful Resources
- ggplot2 - Quick Guide
- ggplot2 - Useful Resources
- ggplot2 - Discussion
ggplot2 - Introduction
ggplot2 is an R package which is designed especially for data visualization and providing best exploratory data analysis. It provides beautiful, hassle-free plots that take care of minute details like drawing legends and representing them. The plots can be created iteratively and edited later. This package is designed to work in a layered fashion, starting with a layer showing the raw data collected during exploratory data analysis with R then adding layers of annotations and statistical summaries.
Even the most experienced R users need help for creating elegant graphics. This library is a phenomenal tool for creating graphics in R but even after many years of near-daily use we still need to refer to our Cheat Sheet.
This package works under deep grammar called as “Grammar of graphics” which is made up of a set of independent components that can be created in many ways. “Grammar of graphics” is the only sole reason which makes ggplot2 very powerful because the R developer is not limited to set of pre-specified graphics which is used in other packages. The grammar includes simple set of core rules and principles.
In the year 2005, Wilkinson created or rather originated the concept of grammar of graphics to describe the deep features which is included between all statistical graphics. It focuses on the primary of layers which includes adapting features embedded with R.
Relationship between “Grammar of Graphics” and R
It tells the user or developer that a statistical graphic is used for mapping the data to aesthetic attributes such as color, shape, size of the concerned geometric objects like points, lines and bars. The plot may also contain various statistical transformations of the concerned data which is drawn on the mentioned coordinate system. It also includes a feature called as “Faceting” which is generally used to create the same plot for different subsets of the mentioned dataset. R includes various in-built datasets. The combination of these independent components totally comprises a particular graphic.
Now let us focus on different types of plots which can be created with reference to the grammar −
Data
If user wants to visualize the given set of aesthetic mappings which describes how the required variables in the data are mapped together for creation of mapped aesthetic attributes.
Layers
It is made up of geometric elements and the required statistical transformation. Layers include geometric objects, geoms for short data which actually represent the plot with the help of points, lines, polygons and many more. The best demonstration is binning and counting the observations to create the specific histogram for summarizing the 2D relationship of a specific linear model.
Scales
Scales are used to map values in the data space which is used for creation of values whether it is color, size and shape. It helps to draw a legend or axes which is needed to provide an inverse mapping making it possible to read the original data values from the mentioned plot.
Coordinate System
It describes how the data coordinates are mapped together to the mentioned plane of the graphic. It also provides information of the axes and gridlines which is needed to read the graph. Normally it is used as a Cartesian coordinate system which includes polar coordinates and map projections.
Faceting
It includes specification on how to break up the data into required subsets and displaying the subsets as multiples of data. This is also called as conditioning or latticing process.
Theme
It controls the finer points of display like the font size and background color properties. To create an attractive plot, it is always better to consider the references.
Now, it is also equally important to discuss the limitations or features which grammar doesn’t provide −
It lacks the suggestion of which graphics should be used or a user is interested to do.
It does not describe the interactivity as it includes only description of static graphics. For creation of dynamic graphics other alternative solution should be applied.
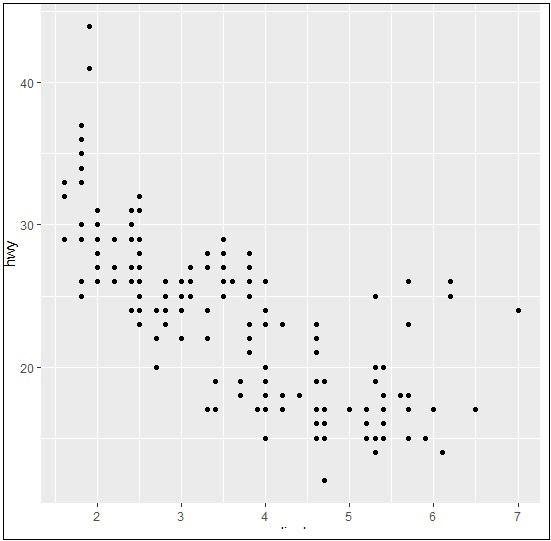
The simple graph created with ggplot2 is mentioned below −