- Forex Trading Tutorial
- Forex Trading - Home
- Forex Trading - Introduction
- The structure of the forex market
- Major Currencies & Trade Systems
- Types of Market Analysis
- Kinds of Foreign Exchange Market
- Benefits of Trading Forex
- Driving Forces behind Forex Market
- Fundamental Market Forces
- Technical Indicators
- Pattern Study of Trends, Support and Resistance
- Technical Strategy in Price Patterns
- Oscillator Divergences
- The Role of Inflation
- The Commodity Connection
- Position Sizing & Money Management
- Foreign Exchange Risks
- Trading Rules to Live By
- Forex Trading Useful Resources
- Forex Trading - Quick Guide
- Forex Trading - Useful Resources
- Forex Trading - Discussion
Technical Strategy in Price Patterns
Technical analysis is based on the assumption that security (e.g. currency pair) prices move in trends. In addition, trends do not last forever. They eventually change direction from one trend to another. Typically, prices move randomly from decelerate, pause and then reverse. This change in phases (trends) occurs as traders or investors form new expectations and by doing so, shift the security (equity or currency pair) supply/demand lines.
This change of expectation of traders/investor often causes price patterns to emerge.
Price patterns can last for couple of days to multi-months and sometime multi-years also.
Price Action Patterns
To understand price action, you need to know how the security or market behaved in the past. This is followed by observing what is happening in the present and then based on past and present market behavior; predict where the market will move next.
A technical analyst or a trader tries to make a trading decision or suggestion based on repeated price patterns of past that were once formed, they predict what direction the security or market is most likely to move.
The common tools to find price patterns are −
chart pattern
candlestick patterns
trendlines
price bands
support and resistance levels
Fibonacci retracement levels, etc.
Because price patterns are technical strategy, we ignore the fundamental analysis – the underlying factor that moves the market. Nevertheless, if we are dealing with FX trade, this fundamental has a huge impact specially on major economic news announcements like the Interest Rate decisions from the central bank, Non-Farm Payroll data, FOMC meet, etc.
Pattern Types
The pattern types are divided into two major categories −
Continuation pattern
Reversal pattern
Continuation Patterns
Continuation patterns are used to find opportunities for traders or technical analyst to continue with the trend.
Generally after a huge price rally, buyers usually close all their long positions, take a pause to “breath” before starting to buy again. Similarly, after a big drop in prices, sellers will take a pause and get out of their short position before continuing to sell again. During pause after a huge rally or selloff, prices consolidate and end up forming certain patterns.
Continuation patterns are said to be complete once the prices break out and continue in the direction of their prevailing trend (uptrend or downtrend).
The most common continuation patterns are −
Flags
Pennants
Triangles
Wedges
Rectangles
Reversal Patterns
It shows a transitional phase that points to the turning point between up trending or down trending market or security.
We can consider this as a point where in a downtrend of a market or security, more buyers find a value attractive (in investing or trading, may be buyers find the fundamentals are not that weak and its current value is good to buy) and they outweigh the sellers. At the end of uptrend market or security, the reverse process occurs (the sellers outweigh the buyers).
The most important reversal patterns are −
Head & Shoulders & Inverse Head and Shoulders
Rounding Bottom
Double tops and bottoms
Triple tops and bottoms
Spike (V)
Building the Price Pattern Rules
A market participant who knows how to use the price action pattern correctly can often increase his performance and his way of looking at charts significantly.
Follow these rules while building price patterns −
Highs and lows
The correct analysis of high and low points of a security or market provides information about trend strength, trend direction and can even give some hint on the end of trends and trade price reversal in advance. These high and low points also build the foundation of the Dow Theory, which has been around for decades and is a principle commonly practised by technical analysts.
Uptrends – Higher highs and higher lows
A security (stock/ currency) is in uptrend if the highs and lows rise. The rising highs show that there are more buyers to push the price higher and rising lows show that during security correction, sellers are losing ground on each correction.
A trend change
Whenever we see a market or security price fail to make a new high (previously uptrend) or new low (previously downtrend), it can serve as an early warning signal that a change in direction (trend is breaking) is imminent.
Strength of a trend: length and steepness of trend-waves
The strength of a trend is determined by the trend waves it creates between the highs and lows. The length/size and the steepness of those individual trend waves determine the strength of a trend.
Consider the following chart to understand this −
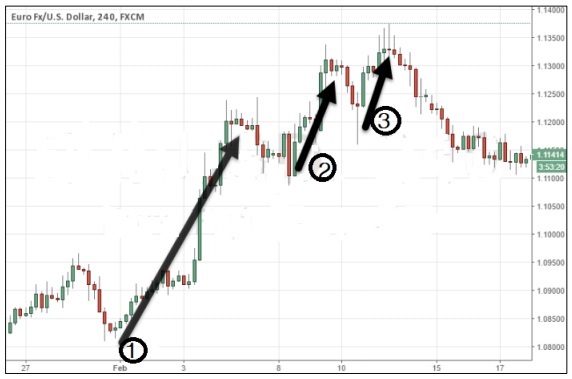
In the above chart, we can see the first trend wave (1) was the longest and very steep. The second trend wave (2) is shorter and less steep and the third trend wave (3) is the shortest and marginally passes the previous high (that shows the saturation point is near, and a trend reversal might happen.). Therefore, we can anticipate the trend reversal (direction) by understanding the concepts of trend-wave length and its steepness.
Strength of trends: depth of pullbacks
Once we have identified the current trend of the market/security, the pullbacks within that trend can provide valuable information about the future direction.
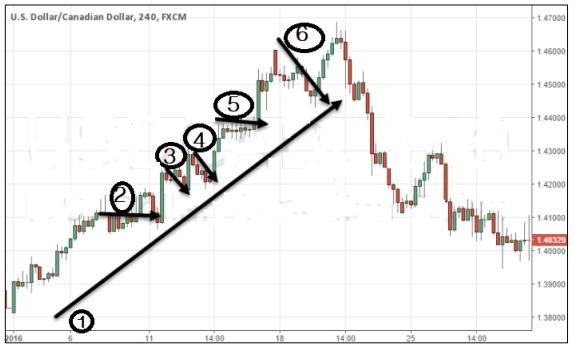
In the above chart, we can see that the major trend (trend line 1) is uptrend with many consolidation and retracements (minor trend line – 2, 3, 4, 5, 6). However, just before the trend reversal sign indicates (downtrend), the final retracement is much larger in size and duration (time), indicating a change in demand-supply scenario.