- Forex Trading Tutorial
- Forex Trading - Home
- Forex Trading - Introduction
- The structure of the forex market
- Major Currencies & Trade Systems
- Types of Market Analysis
- Kinds of Foreign Exchange Market
- Benefits of Trading Forex
- Driving Forces behind Forex Market
- Fundamental Market Forces
- Technical Indicators
- Pattern Study of Trends, Support and Resistance
- Technical Strategy in Price Patterns
- Oscillator Divergences
- The Role of Inflation
- The Commodity Connection
- Position Sizing & Money Management
- Foreign Exchange Risks
- Trading Rules to Live By
- Forex Trading Useful Resources
- Forex Trading - Quick Guide
- Forex Trading - Useful Resources
- Forex Trading - Discussion
Forex Trading - Oscillator Divergences
Divergence simply means “separate”. Generally, the price of a security and indicator follow the same path. This is confirmed by the oscillator and traders can expect the trend to continue.
There comes a point when the path of the oscillator and price divert from each other. At this point, divergence pattern also indicates that the trend is weaker. After the divergence signal appears, there is a higher chance of reversal, especially if divergence appears on a higher time frame.
Technical Indicators
There are various kinds of technical analysis indicators but all have one thing in common; all the indicators use security (equity, currency, commodity etc.) prices (open, high, low, close and volume) in their calculations.
We can divide all technical indicator into two main types −
Leading Indicators − Leading indicators lead the price movement. These indicators give signal before a new trend or when a reversal occurs.
Lagging Indicators − Lagging indicators follow the price action. These indicators give signal after the trend or when a reversal has started.
Categories of Indicators
The different types of indicators fall under the following categories −
Trend Indicators
Volume Indicators
Momentum Indicators
Volatility Indicators
Trend Indicators
Trend indicators show traders/investors the trend or direction of the security being traded. A trend can be one of these −
Bullish trends (security prices go up with minor downfall).
Bearish trends (security prices come down with minor up movement).
Sideways trends (security prices are moving in a tight range and not giving any signal of upward or downward major movement).
Note − Security can be an equity (stock), commodity (like gold) or currency (USD).
Following are some of the major trend indicators −
Moving averages
MACD
Average directional index
Linear regression
Forecast oscillator
Parabolic SAR
Example
We can buy a security (USD) if its closing price is higher than the 30 days simple moving average −
BUY (when) close > sma(30)
Volume Indicators
The volume of trades of a security is a very important component of trading. Every trader takes notice of the volume of trades in determining the signal (buy, sell or hold) strength.
Following are some important volume indicators −
Money Flow Index
Ease Of movement
Chaikin money flow
On balance volume
Demand index
Force index
Example
Many tradersr sell the security when Money Flow Index enters an oversold area −
sell (when) mfi(30) < 30
Momentum Indicators
The momentum (how fast or slow) is a measure of the speed at which the security value moves in a given period.
Most traders follow momentum indicators where security price is moving in one direction with huge volumes.
Commonly used momentum indicators are as follows −
RSI
Stochastics
CCI
Commodity Channel Index
Williams %R
Chande’s momentum oscillator
Traders used momentum indicators to determine overbought and oversold positions.
Example
One widely used indicators among traders is the RSI, where once the security enters into an oversold area they buy it and once it enters into the overbought area they sell. It is determined by the Relative Strength Index indicator (RSI).
Volatility Indicators
Most traders use volatility indicators to get the buy or sell signals .
The volatility is the rate of change or relative rate at which the security prices move (up or down). A high volatile security means prices can suddenly move very high or very low over a short period of time. Inversely, if the security is less volatile, it means its prices move gradually.
Following are a few commonly used volatility indicators −
Bollinger bands
Envelopes
Average true range
Volatility channels indicators
Chaikin volatility indicator
Projection oscillator
Though volatility is usually measured in standard deviation, there are many other measures to check the volatility of assets −
Close-to-Close ( C )
Exponentially weighted ( C)
Parkinson (HL)
Garman-Klass (OHLC)
Rogers-Satchell (OHLC)
Yang-Zhang (OHLC)
Here,
O = Open price
C = Close price
L = Low price
H = High price of the security
Example
Let us take the Bollinger band indicator for example. A trader may sell a security when the prices go below the lower Bollinger band.
sell (when) prices cross(BbandsLower (30, 2, _MaSma), close)
Relative Strength Index (RSI)
The RSI is part of a class of indicators called the momentum oscillators.
An oscillator is an indicator that moves back and forth across a reference line or between prescribed upper and lower limits. When an oscillator reaches new high, it shows that an uptrend is gaining speed and will continue to do so. Inversely, when an oscillator traces a lower peak, it means the trend has stopped accelerating and a reversal can be expected from there.
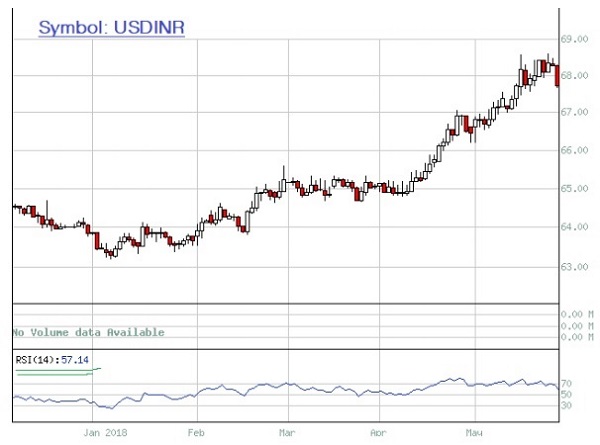
The momentum oscillator like the RSI is referred to as a trend-leading indicator. The momentum is calculated as the ratio of positive price changes to negative price changes. The RSI analysis compares the current RSI against neutral (50%), oversold (30%) and overbought (70%) conditions.
The following figure shows the RSI analysis of USDINR where RSI shows a value of 57.14 % value, which is between neutral and oversold.
Application of RSI
RSI is a momentum oscillator used in sideways or ranging markets where the security (equity or currency) or market moves between support and resistance levels. Many traders to measure the velocity of directional price movement use it.
Overbought and Oversold
The RSI is a price-following oscillator that ranges between 0 and 100. Mostly, traders use 30% as oversold region and 70% as overbought region to generate buy and sell signals. Traders or TA generally abide by the following −
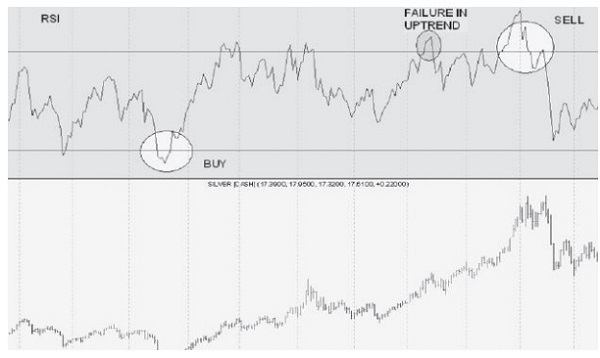
Go long when the indicator moves from below to above the oversold line.
Go short when the indicator moves from above to below the overbought line.
Following is a silver chart showing buy and sell point, and failure in trending market.
Divergence
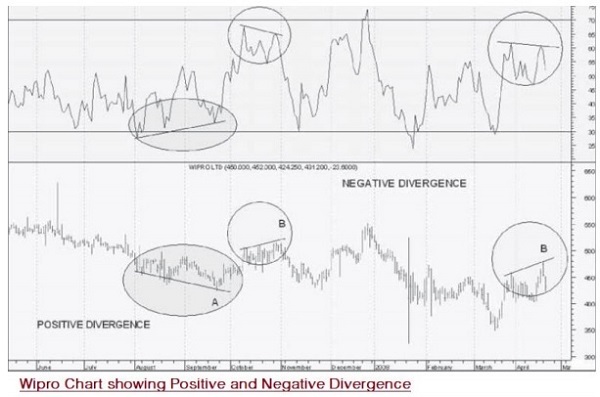
The way to look at RSI is through divergences between price peaks/troughs and indicator peaks/ troughs.
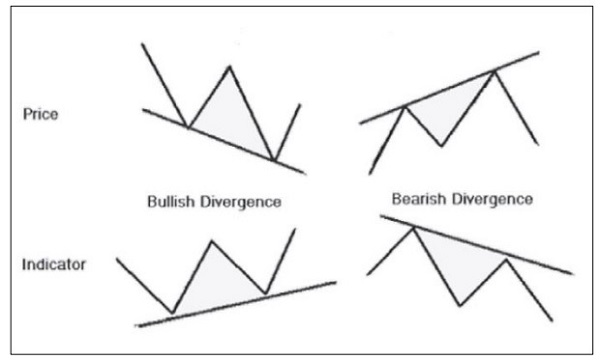
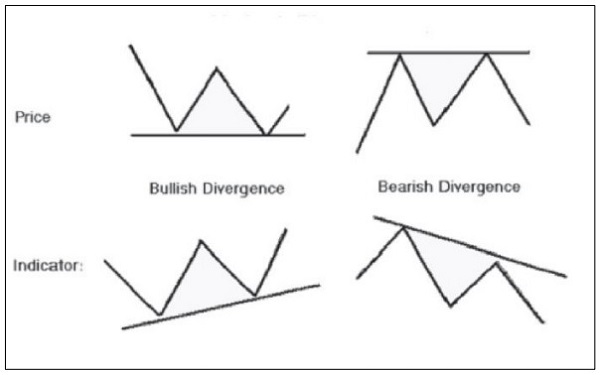
A positive divergence occurs when the RSI makes a higher bottom despite lower trending by share price. This indicates the downward movement is running out of strength and an upward reversal can soon be expected.
Similarly, a negative divergence occurs when the RSI starts failing and makes a lower top despite share prices moving higher. Since there is less power or support for the new higher price a reversal could be expected.
A bullish divergence represents upward price pressure and a bearish divergence represents downward price pressure.
The following diagrams show strong divergence −
The following diagram shows moderate divergence −
Estimating Price Targets
Traders and investors benefit by trading in the direction of the trend. The RSI is also used for determining and confirming the trend.
A security (stock or currency) which is in strong uptrend will rarely fall below 40 and usually moves between 40 and 80 levels. In such a case, when the RSI approaches 40, a trader can use this opportunity to buy, and when it comes close to 80, it can be a squareoff signal. Therefore, traders should not go short on a counter that is in a strong uptrend. Similarly, if the security is in a strong downtrend, its RSI usually moves between 60 and 20; and if it comes close to 60, it can be used for selling short.
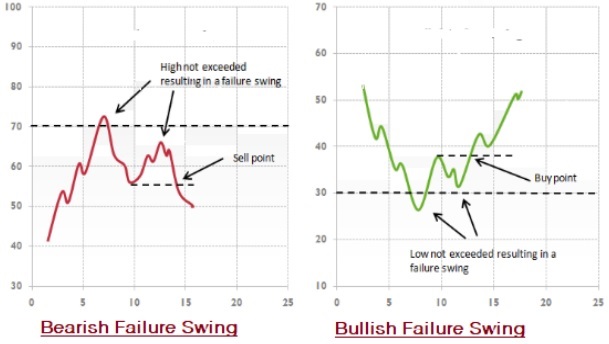
Failure swings are considered as strong signals of an impending reversal.
Bullish Failure Swing (for buying)
This takes place when the RSI moves below 30 (oversold), bounces above 30, pulls back, holds above 30 and then breaks its prior high. It moves to oversold levels and then a higher low above oversold levels.
Bearish Failure Swing (for selling)
This takes place when the RSI moves above 70, pulls back, bounces, fails to cross 70 and then breaks its prior low. It is a move to overbought levels and then a lower high below overbought levels.
The following diagrams show the Bullish and Bearish Swing Failure −