- Excel Pivot Tables Tutorial
- Excel Pivot Tables - Home
- Excel Pivot Tables - Overview
- Excel Pivot Tables - Creation
- Excel Pivot Tables - Fields
- Excel Pivot Tables - Areas
- Excel Pivot Tables - Exploring Data
- Excel Pivot Tables - Sorting Data
- Excel Pivot Tables - Filtering Data
- Filtering data using Slicers
- Excel Pivot Tables - Nesting
- Excel Pivot Tables - Tools
- Summarizing Values
- Excel Pivot Tables - Updating Data
- Excel Pivot Tables - Reports
- Excel Pivot Tables Useful Resources
- Excel Pivot Tables - Quick Guide
- Excel Pivot Tables - Resources
- Excel Pivot Tables - Discussion
Excel Pivot Tables - Tools
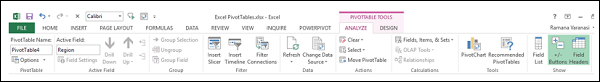
In the worksheet containing a PivotTable, the Ribbon will contain the PivotTable Tools, with ANALYZE and DESIGN Tabs. The ANALYZE tab has several commands that will enable you to explore the data in the PivotTable. The DESIGN tab commands will be useful to structure the PivotTable with various report options and style options.
You will learn the ANALYZE commands in this chapter. You will learn the DESIGN commands in the Chapter - Aesthetic Reports with PivotTables.
ANALYZE Commands
The commands on the Ribbon of ANALYZE tab include the following −
- Expanding and Collapsing a Field.
- Grouping and Ungrouping Field Values.
- Active Field Settings.
- PivotTable Options.
Expanding and Collapsing a Field
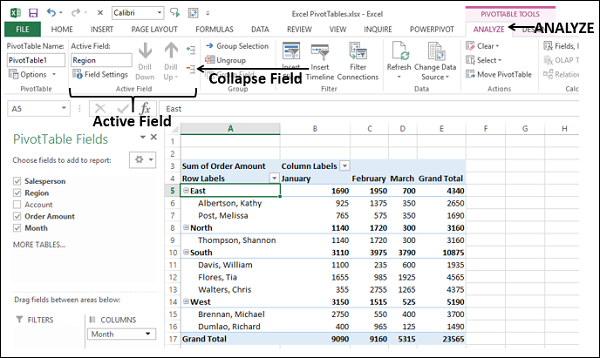
If you have nested fields in your PivotTable, you can expand and collapse a single item or you can expand and collapse all the items of the active field.
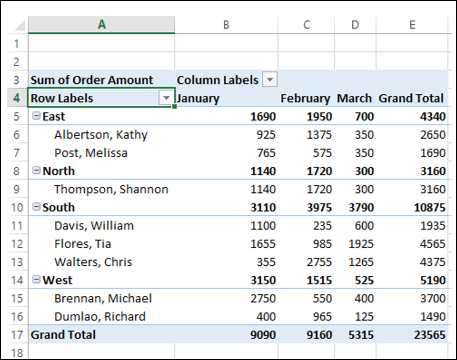
Consider the following PivotTable, wherein you have Salesperson field nested under Region field.
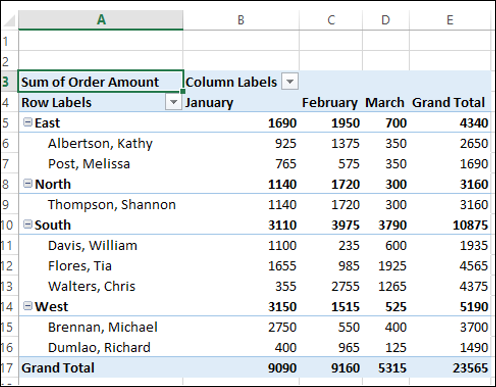
Click the  symbol to the left of East. The item East of the field Region will collapse.
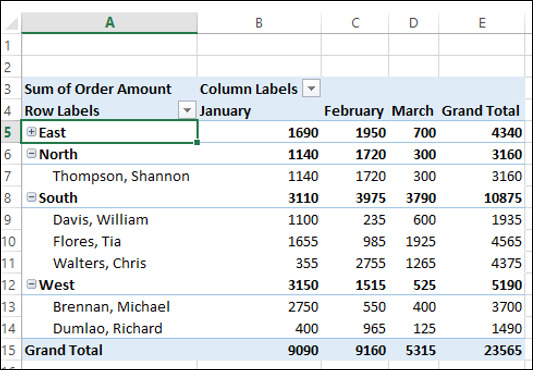
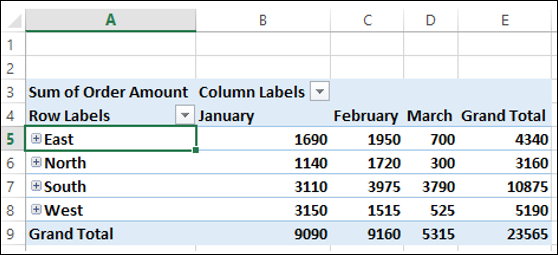
As you can observe, the other items - North, South and West of the field Region are not collapsed. If you want to collapse any of them, repeat the steps that you have done for East.
Click on the
 symbol to the left of East. The item East of the field Region will expand.
If you want to collapse all the items of a field at once, do the following −
- Click any of the items of the field – Region.
- Click the ANALYZE tab on the Ribbon.
- Click Collapse Field in the Active Field group.
All the items of the field Region will be collapsed.
If you want to expand all the items of a field at once, do the following −
- Click on any of the items of the field – Region.
- Click the ANALYZE tab on the Ribbon.
- Click Expand Field in the Active Field group.
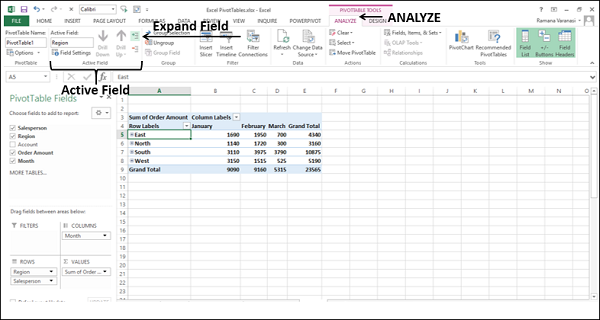
All the items of the field Region will be expanded.
Grouping and Ungrouping Field Values
You can group and ungroup field values to define your own clustering. For example, you might want to know the data combining East and North regions.
Select the East and North items of the Region field in the PivotTable, along with the nested Salesperson field items.
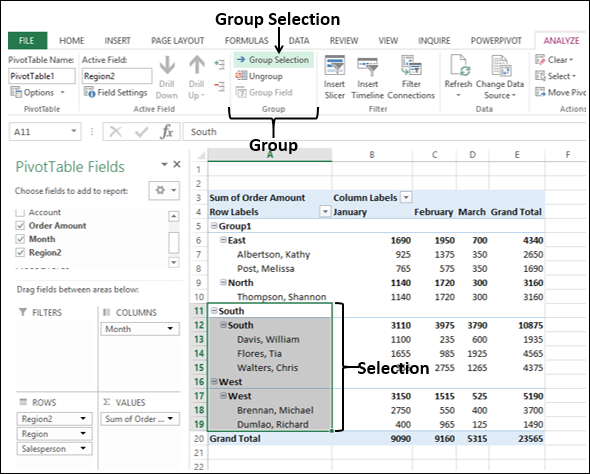
Click the ANALYZE tab on the Ribbon.
Click Group Selection in the group – Group.
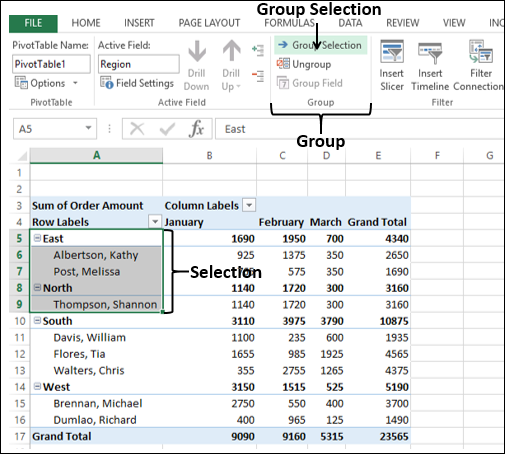
The items – East and North will be grouped under the name Group1. In addition, a new South is created under which South is nested and a new West is created under which West is nested.
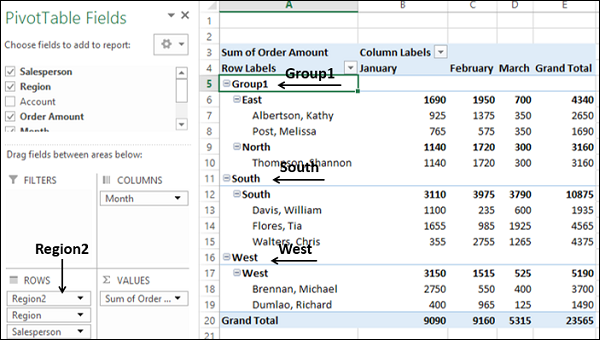
You can also observe that a new field – Region2 is added in the PivotTable Fields list, which appears in the ROWS area.
Select the South and West items of the Region2 field in the PivotTable, along with the nested Region and Salesperson field items.
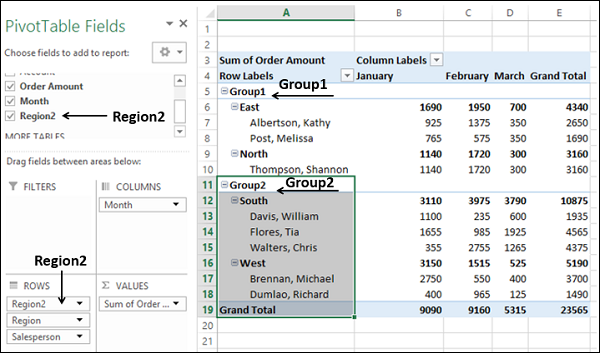
Click the ANALYZE tab on the Ribbon.
Click Group Selection in the group – Group.
The items – South and West of the field Region will be grouped under the name Group2.
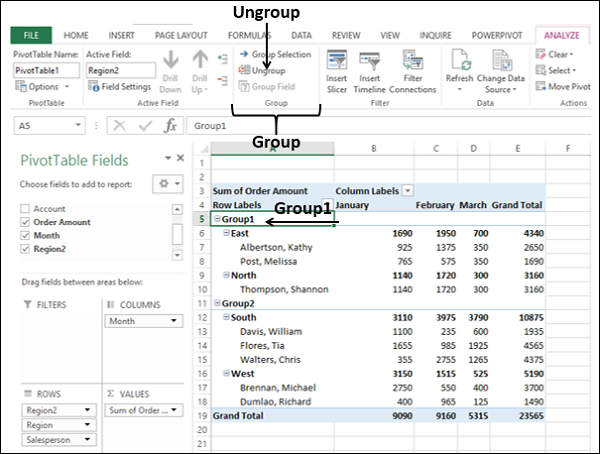
To ungroup a group, do the following −
- Click on the Group Name.
- Click the ANALYZE tab.
- Click Ungroup in the group – Group.
Grouping by a Date Field
Consider the following PivotTable, wherein you have the employee data summarized by Count of EmployeeID, hiredate wise and title wise.
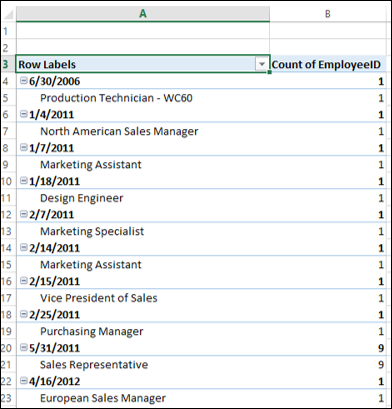
Suppose you want to group this data by the HireDate field that is a Date field into years and quarters.
- Click on a Date item in the PivotTable.
- Click the ANALYZE tab on the Ribbon.
- Click Group Field in the group – Group.
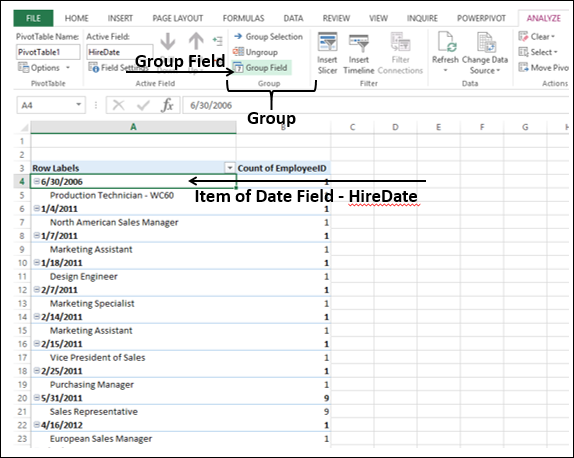
The Grouping dialog box appears.
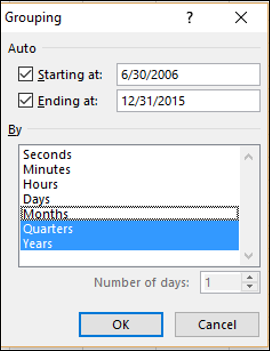
Set the dates for – Starting at and Ending at.
Select Quarters and Years in the box under By. To select / deselect multiple items, keep the Ctrl-key pressed.
Click OK.
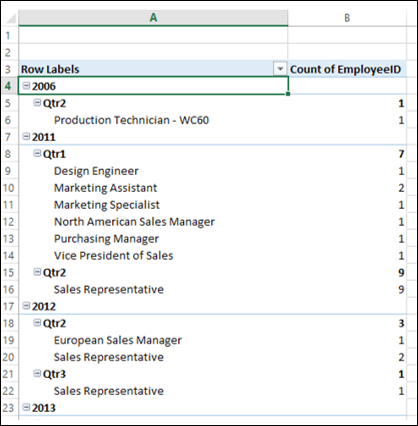
The HireDate field values will be grouped into Quarters, nested in Years.
If you want to ungroup this grouping, you can do as shown earlier, by clicking Ungroup in the group – Group on the Ribbon.
Active Value Field Settings
You can set a field options by clicking on a value of that field. Consider the example of sales data that we used earlier in this chapter.
Suppose you want to set the options for the Region field.
Click on East. On the Ribbon, in the Active Field group, in the Active Field box, Region will be displayed.
Click on Field Settings. The Field Settings dialog box appears.
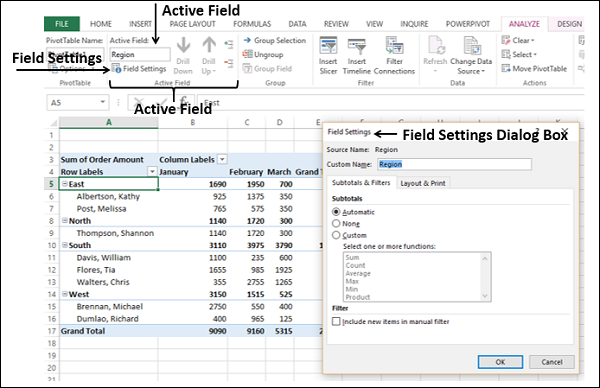
You can set your preferences for the field – Region.
PivotTable Options
You can set the PivotTable Options according to your preferences.
- Click on the PivotTable.
- Click the ANALYZE tab.
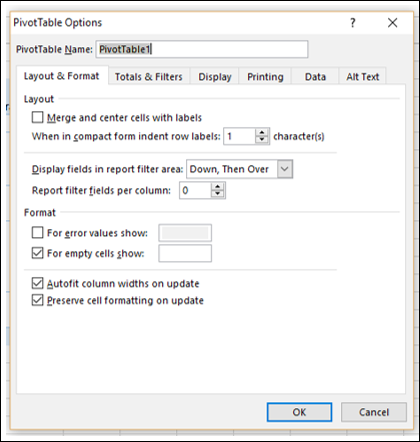
- Click Options in the PivotTable group.
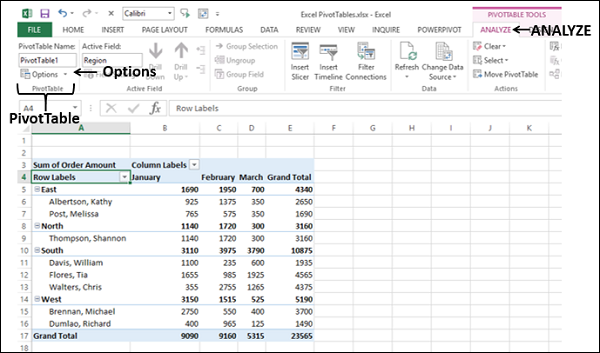
The PivotTable Options dialog box appears. You can set your preferences in the dialog box.