- Excel Pivot Tables Tutorial
- Excel Pivot Tables - Home
- Excel Pivot Tables - Overview
- Excel Pivot Tables - Creation
- Excel Pivot Tables - Fields
- Excel Pivot Tables - Areas
- Excel Pivot Tables - Exploring Data
- Excel Pivot Tables - Sorting Data
- Excel Pivot Tables - Filtering Data
- Filtering data using Slicers
- Excel Pivot Tables - Nesting
- Excel Pivot Tables - Tools
- Summarizing Values
- Excel Pivot Tables - Updating Data
- Excel Pivot Tables - Reports
- Excel Pivot Tables Useful Resources
- Excel Pivot Tables - Quick Guide
- Excel Pivot Tables - Resources
- Excel Pivot Tables - Discussion
Excel Pivot Tables - Sorting Data
You can sort the data in a PivotTable so that it will be easy for you to find the items you want to analyze. You can sort the data from lowest to highest values or highest to lowest values or in any other custom order that you choose.
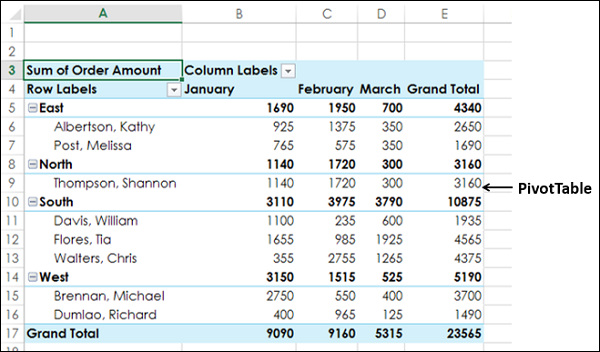
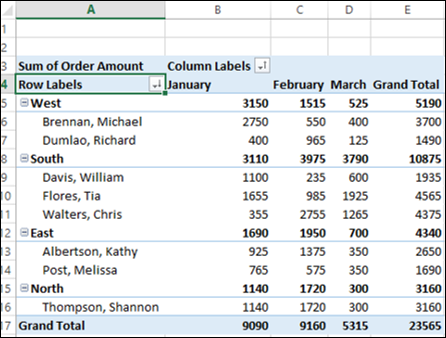
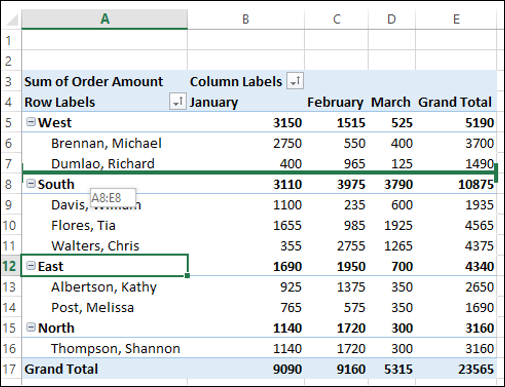
Consider the following PivotTable wherein you have the summarized sales data region-wise, salesperson-wise and month-wise.
Sorting on Fields
You can sort the data in the above PivotTable on Fields that are in Rows or Columns – Region, Salesperson and Month.
To sort the PivotTable with the field Salesperson, proceed as follows −
Click the arrow
 in the Row Labels.
Select Salesperson in the Select Field box from the dropdown list.
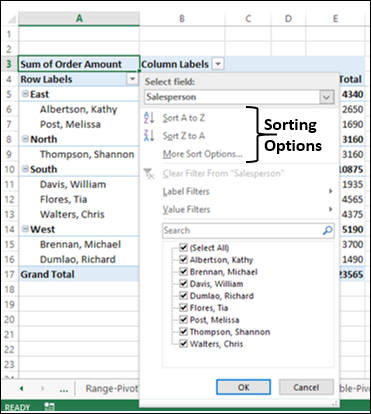
The following sorting options are displayed −
- Sort A to Z.
- Sort Z to A.
- More Sort Options.
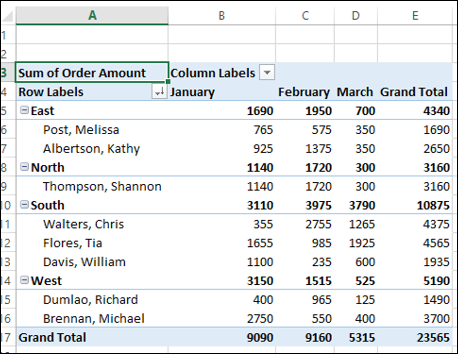
Further, the Salesperson field is sorted in ascending order, by default. Click Sort Z to A. The Salesperson field will be sorted in descending order.
In the same way, you can sort the field in column – Month, by clicking on the arrow ![]() in the column labels.
in the column labels.
Sorting on Subtotals
Suppose you want to sort the PivotTable based on total order amount – highest to lowest in every Region. That is, you want to sort the PivotTable on subtotals.
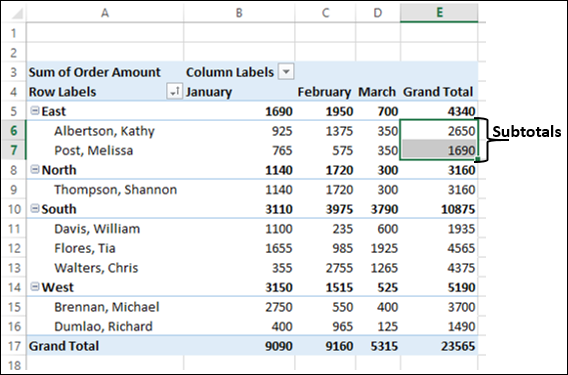
You can see that there is no arrow ![]() for subtotals. You can still sort the PivotTable on subtotals as follows −
for subtotals. You can still sort the PivotTable on subtotals as follows −
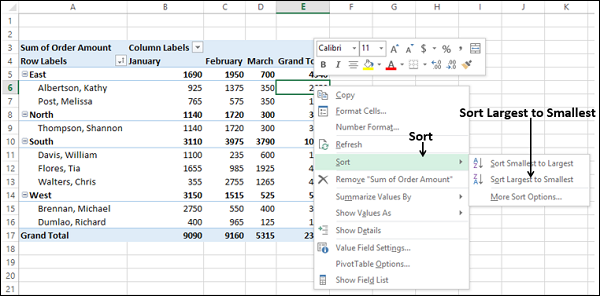
Right-click on the subtotal of any of the Salespersons in the Grand Total column.
Select Sort from the dropdown list.
Another dropdown list appears with the sorting options – Sort Smallest to Largest, Sort Largest to Smallest and More Sort Options. Select Sort Largest to Smallest.
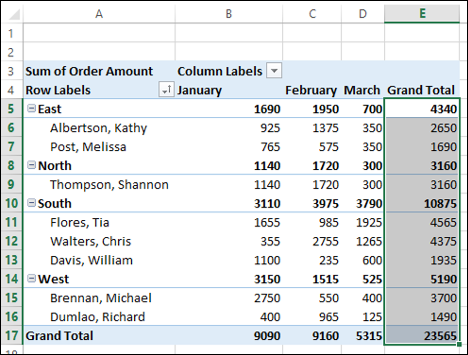
The subtotals in the Grand Total column are sorted from highest to lowest values, in every region.
Likewise, if you want to sort the PivotTable on subtotals region wise, do the following −
Right click on the subtotal of any of the regions in the Grand Total column.
Click Sort in the dropdown list.
Click Sort Largest to Smallest in the second dropdown list. The PivotTable will get sorted on subtotals region-wise.
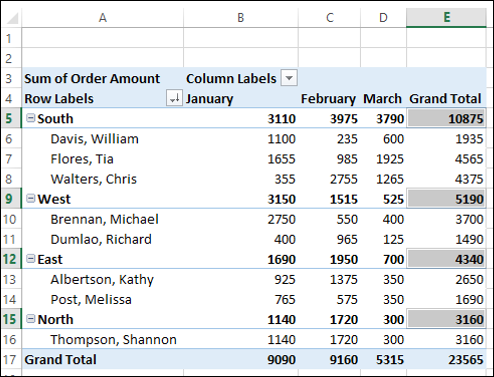
As you can observe, South has the highest order amount while North has the lowest.
You can also sort the PivotTable based on the total amount month wise as follows −
- Right click on any of the Subtotals in the Grand Total row.
- Select Sort from the dropdown list.
- Select Sort Largest to Smallest from the second dropdown list.
The PivotTable will be sorted on total amount month wise.
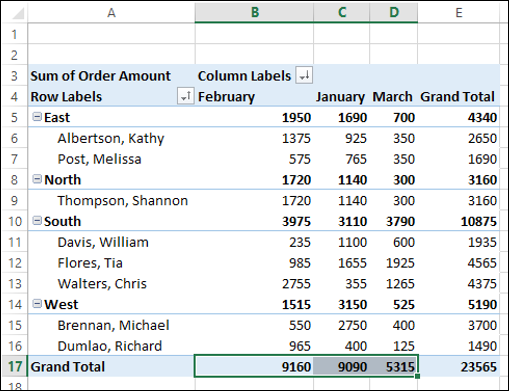
You can observe that February has highest order amount while March has the lowest.
More Sort Options
Suppose you want to sort the PivotTable on total amount region wise in the month of January.
Click on the arrow
in Row Labels.Select More Sort Options from the dropdown list. The Sort (Region) dialog box appears.
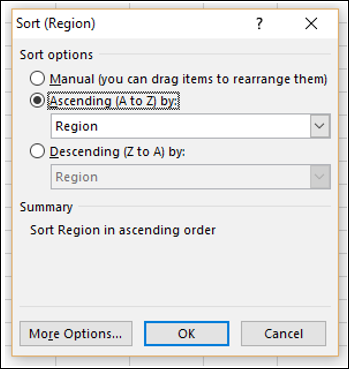
As you can observe, under Summary, the current Sort order is given as Sort Region in ascending order. Ascending (A to Z) by is selected under Sort Options. In the box below that, Region is displayed.
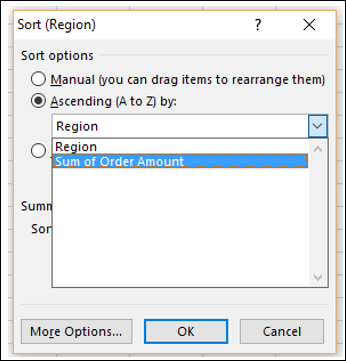
- Click the box containing Region.
- Click Sum of Order Amount.
Click the More Options button. The More Sort Options (Region) dialog box appears.
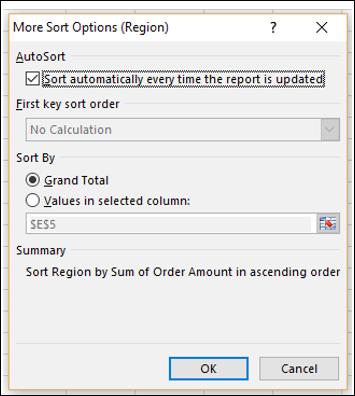
As you can observe, under Sort By, Grand Total is selected. Under Summary, the current sort order is given as Sort Region by Sum of Order Amount in ascending order.
Click Values in selected column: under Sort By.
In the box below that, type B5.
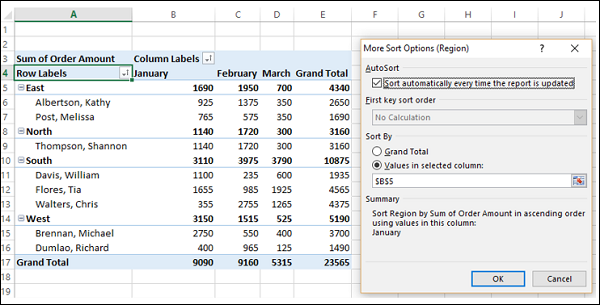
As you can observe, under Summary, the current sort order is given as follows −
Sort Region by Sum of Order Amount in ascending order using values in this column: January. Click OK.
The Sort (Region) dialog box appears. Select Descending (Z to A) by: under Sort Options.
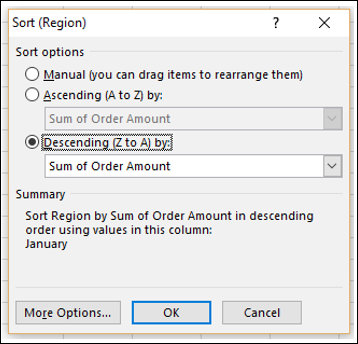
Under Summary, the current sort order is given as follows −
Sort Region by Sum of Order Amount in descending order, using values in this column: January. Click OK. The PivotTable will be sorted on region, using values in January.
As you can observe, in the month of January, West has the highest order amount while North has the lowest.
Sorting Data Manually
In the PivotTable, the data is sorted automatically by the sorting option that you have chosen. This is termed as AutoSort.
Place the cursor on the arrow ![]() in Row Labels or Column Labels.
in Row Labels or Column Labels.
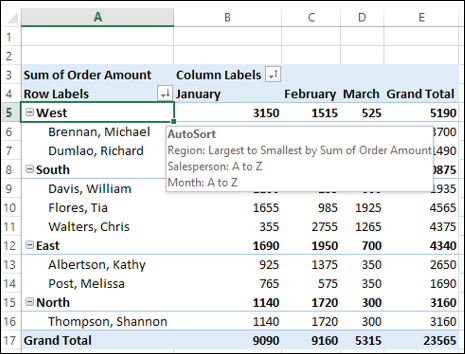
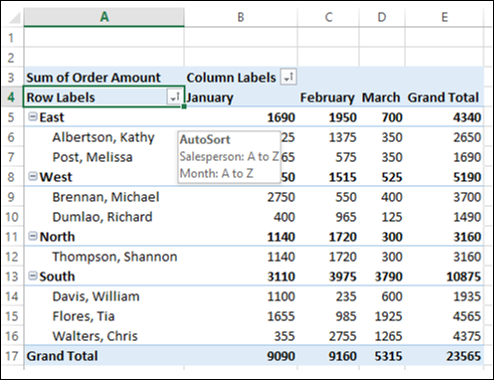
AutoSort appears, showing the current sort order for each of the fields in the PivotTable. Now, suppose you want to sort the field Region in the order – East, West, North and South. You can do this manually, as follows −
Click the arrow
in Row Labels.Select Region in the Select Field box from the dropdown list.
Click More Sort Options. The Sort (Region) dialog box appears.
Select Manual (you can drag items to rearrange them).
Click OK.
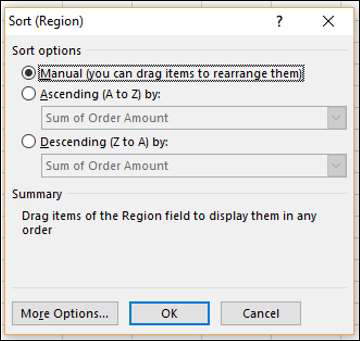
Under Summary, the current sort order is given as Drag items of the Region field to display them in any order.
Click on the East and drag it to the top. While you are dragging East, a horizontal green bar appears across the entire row moves.
Repeat the dragging with other items of the Region field until you get the required arrangement.
You can observe the following −
The items of the nested field – Salesperson also move along with the corresponding Region field item. Further, the values in the other columns also moved accordingly.
If you place the cursor on the arrow
in Row Labels or Column Labels, AutoSort appears showing the current sort order of the fields Salesperson and Month only. As you have sorted Region field manually, it will not show up in AutoSort.
Note − You cannot use this manual dragging of items of the field that is in ∑ VALUES area of the PivotTable Fields list. Therefore, you cannot drag the Sum of Order Amount values in this PivotTable.
Setting Sort Options
In the previous section, you have learnt how to set the sorting option for a field to manual. You have some more sort options that you can set as follows −
Click the arrow
in Row Labels.Select Region in the Select Field box.
Click More Sort Options. The Sort (Region) dialog box appears.
Click the More Options button.
More Sort Options (Region) dialog box appears. You can set more sort options in this dialog box.
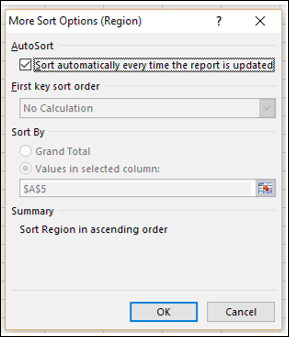
Under AutoSort, you can check or uncheck the box - Sort automatically every time the report is updated, to allow or stop automatic sorting whenever the PivotTable data is updated.
- Uncheck the box – Sort automatically every time the report is updated.
Now, First key sort order option becomes available. You can use this option to select the custom order you want to use.
- Click the box under First key sort order.
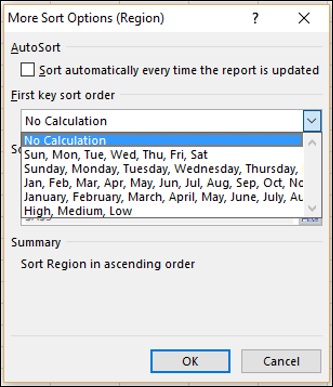
As you can observe, day-of-the-week and month-of-the year custom lists are provided in the dropdown list. You can use any of these, or you can use your own custom list such as High, Medium, Low or the sizes list S, M, L, XL that are not in alphabetical order.
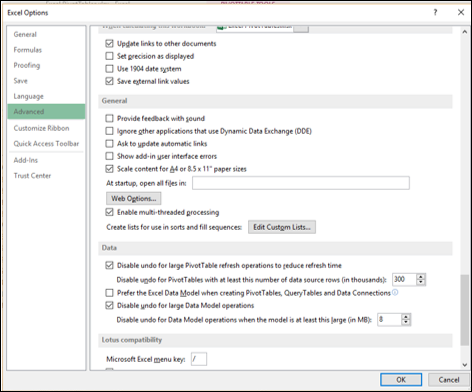
You can create your custom lists from the FILE tab on the Ribbon. FILE → Options. In the Excel Options dialog box, click on advanced and browse to General. You will find the Edit Custom Lists button next to Create lists for use in sort and fill sequences.
Note that a custom list sort order is not retained when you update (refresh) data in your PivotTable.
Under Sort By, you can click Grand Total or Values in selected columns to sort by these values. This option is not available when you set sorting to Manual.
Points to consider while sorting PivotTables
When you sort data in a PivotTable, remember the following −
Data that has leading spaces will affect the sort results. Remove any leading spaces before you sort the data.
You cannot sort case-sensitive text entries.
You cannot sort data by a specific format such as cell or font color.
You cannot sort data by conditional formatting indicators, such as icon sets.