- Excel Data Analysis Tutorial
- Excel Data Analysis - Home
- Data Analysis - Overview
- Data Analysis - Process
- Excel Data Analysis - Overview
- Working with Range Names
- Tables
- Cleaning Data with Text Functions
- Cleaning Data Contains Date Values
- Working with Time Values
- Conditional Formatting
- Sorting
- Filtering
- Subtotals with Ranges
- Quick Analysis
- Lookup Functions
- PivotTables
- Data Visualization
- Data Validation
- Financial Analysis
- Working with Multiple Sheets
- Formula Auditing
- Inquire
- Advanced Data Analysis
- Advanced Data Analysis - Overview
- Data Consolidation
- What-If Analysis
- What-If Analysis with Data Tables
- What-If Analysis Scenario Manager
- What-If Analysis with Goal Seek
- Optimization with Excel Solver
- Importing Data into Excel
- Data Model
- Exploring Data with PivotTables
- Exploring Data with Powerpivot
- Exploring Data with Power View
- Exploring Data Power View Charts
- Exploring Data Power View Maps
- Exploring Data PowerView Multiples
- Exploring Data Power View Tiles
- Exploring Data with Hierarchies
- Aesthetic Power View Reports
- Key Performance Indicators
- Excel Data Analysis Resources
- Excel Data Analysis - Quick Guide
- Excel Data Analysis - Resources
- Excel Data Analysis - Discussion
Exploring Data with Hierarchies
If your data more number of levels, it would be easy for you to explore and present it with Hierarchies. For any data value in your Hierarchy, you can drill down to display more details or drill up to have a holistic view.
If your data model has a hierarchy, you can use it in Power View. Otherwise, you can create a hierarchy in the Power View itself with few easy steps.
Creating a Hierarchy in Power View
In Power View a Hierarchy is best depicted in Matrix visualization. Create a Hierarchy in Matrix visualization as follows −
Drag the fields NOC_CountryRegion, Sport, Discipline, Year and Medal – in that order to ROWS area.
Drag the field Medal Count to ∑ VALUES. The order of the fields in the ROWS area defines the Hierarchy in Power View.
If you are not sure about the order of fields, start with any order and then rearrange them in the ROWS area by dragging them up and down, while looking at the display in the Power View.
You will get the following Matrix visualization showing the five Hierarchy levels −
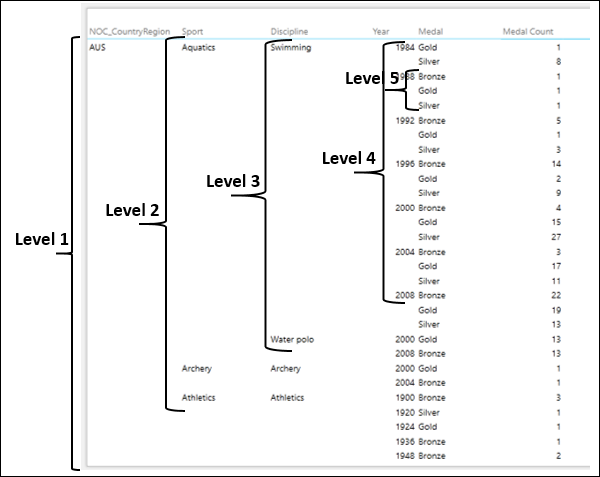
As you observe, the levels are nested.
Drilling Up and Drilling Down the Hierarchy
You can drill up and drill down the hierarchy such that you can show just one level at a time. You can drill down for details and drill up for summary.
To enable drill up and drill down, first set up show levels option as follows −
- Click the DESIGN tab on the Ribbon.
- Click Show Levels in the Options group.
- Select Rows – Enable Drill Down One Level at a Time from the drop-down list.
The Matrix collapses to display only Level 1 data.
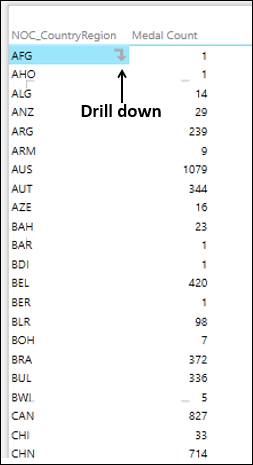
As you observe, when you click on each of the data items, a downward arrow appears on the right side for that item indicating drill down.
Now, you can drill down the data one level at a time as follows −
Click Level 1 data item for which you want further details. For example, click AUS. As you observe, Medal Count for AUS is 1079.
Click on the arrow to the right side of it. Alternatively, you can double click on the data item.
Level 2 data pertaining to AUS will be displayed.
As you observe, an upward arrow appears on the left side of the first item, indicating drill up and when you click on each of the data items, a downward arrow appears on the right side for that item indicating drill down.
Now, you can drill down the data one more level as follows −
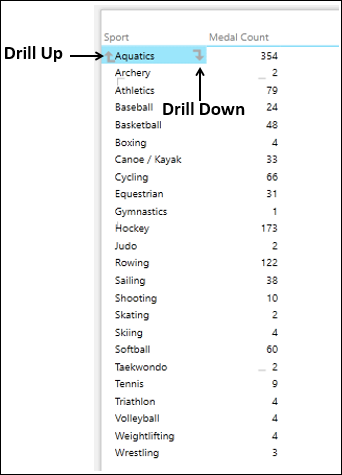
Click Level 2 data item for which you want further details. For example, click Aquatics. As you observe, the medal count for Aquatics is 354.
Click on the arrow to the right side of it.
Level 3 data pertaining to Aquatics will be displayed.
As you observe, an upward arrow appears on the left side of the first item, indicating drill up and when you click on each of the data items, a downward arrow appears on the right side for that item indicating drill down.
Now, you can drill down the data one more level as follows −
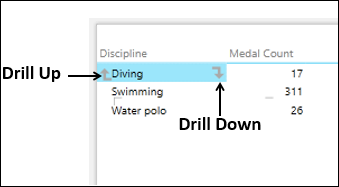
Click Level 3 data item for which you want further details. For e.g. click on Diving. As you observe, the medal count for Diving is 17.
Click on the arrow to the right side of it.
Level 4 data pertaining to Diving will be displayed.
As you observe, an upward arrow appears on the left side of the first item, indicating drill up and when you click on each of the data items, a downward arrow appears on the right side for that item indicating drill down.
Now, you can drill down the data one more level as follows −
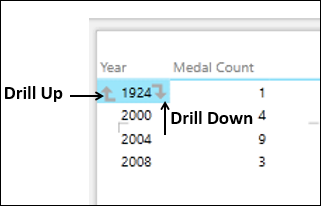
Click on the Level 4 data item for which you want further details. For example, click on 2008. As you observe, the medal count for 2008 is 3.
Click on the arrow to the right side of it.
Level 5 data pertaining to 2008 will be displayed.
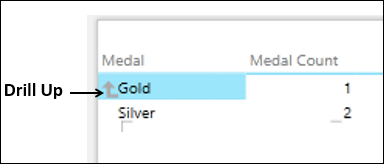
As you observe, for the first Level 5 data item an upward arrow appears on the left side indicating drill up. Drill down arrows do not appear on the right side for the data items as there are further levels to drill down.
Now, you can drill up the data one level at a time by clicking on the upward arrow to the left side of the first item at each Level.
Exploring a Hierarchy in Stacked Bar Chart
You might want to highlight certain values in a hierarchy in a significant way. In such a case, you can use a chart visualization, such as Stacked Bar chart as follows −
- Click the Matrix visualization and switch to Stacked Bar Chart.
- Drag the field Medal to LEGEND area.
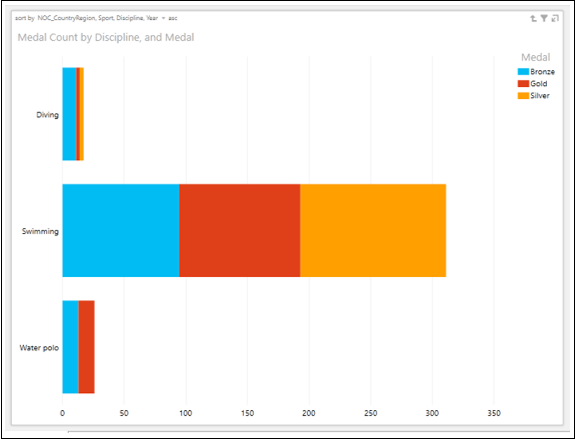
You will get the Stacked Bar chart visualization as follows −
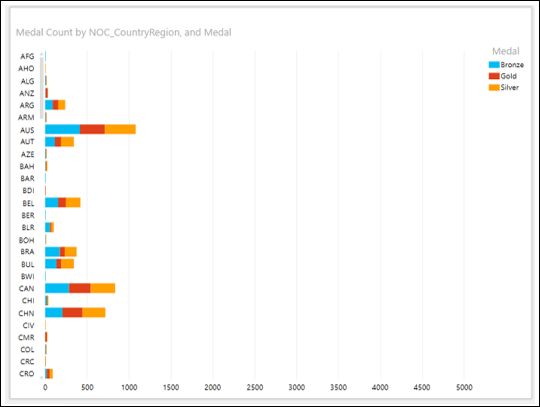
In this case, you need to double-click on a Bar to drill down.
Double-click on Bar representing AUS. The chart is drilled down to display the next level of data in the hierarchy.
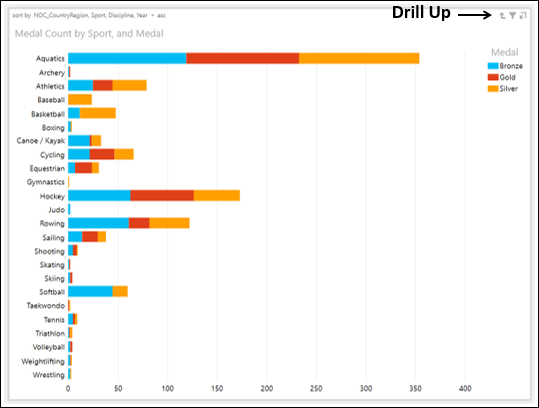
As you can observe, an upward arrow indicating drill up appears at the top-right corner of the chart.
Drill down one more level by double-clicking on Aquatics Bar. The chart is drilled down to display the next level of data in the hierarchy.
You can drill down by double-clicking on a Bar or drill up by clicking on the drill up arrow on the top-right corner of the chart.
This gives you an interactive exploration of data during presentation also.