- Excel Data Analysis Tutorial
- Excel Data Analysis - Home
- Data Analysis - Overview
- Data Analysis - Process
- Excel Data Analysis - Overview
- Working with Range Names
- Tables
- Cleaning Data with Text Functions
- Cleaning Data Contains Date Values
- Working with Time Values
- Conditional Formatting
- Sorting
- Filtering
- Subtotals with Ranges
- Quick Analysis
- Lookup Functions
- PivotTables
- Data Visualization
- Data Validation
- Financial Analysis
- Working with Multiple Sheets
- Formula Auditing
- Inquire
- Advanced Data Analysis
- Advanced Data Analysis - Overview
- Data Consolidation
- What-If Analysis
- What-If Analysis with Data Tables
- What-If Analysis Scenario Manager
- What-If Analysis with Goal Seek
- Optimization with Excel Solver
- Importing Data into Excel
- Data Model
- Exploring Data with PivotTables
- Exploring Data with Powerpivot
- Exploring Data with Power View
- Exploring Data Power View Charts
- Exploring Data Power View Maps
- Exploring Data PowerView Multiples
- Exploring Data Power View Tiles
- Exploring Data with Hierarchies
- Aesthetic Power View Reports
- Key Performance Indicators
- Excel Data Analysis Resources
- Excel Data Analysis - Quick Guide
- Excel Data Analysis - Resources
- Excel Data Analysis - Discussion
Key Performance Indicators
Key Performance Indicators (KPI) are a set of quantifiable measures that an organization uses to measure its performance over time. KPIs are normally used to evaluate the success of an organization as a whole or department-wise (e.g. sales, finance, etc.). You need to define the KPIs based on the organization objectives and monitor them from time to time to track the progress.
There are a number of KPI types to choose from based on your requirements. Examples include −
- Income and Expenses
- Rate of Return
- Average Purchase Value
- Customer Lifetime Value
- Working Capital
Note that KPIs are a form of communication involving the following activities −
Identifying the KPIs based on the organization’s objectives.
Monitoring and reporting the KPIs.
Altering the KPIs as the organization progresses and / or the organization’s goals change.
Identifying the KPIs
The first and the most crucial step in KPI analysis is to identify the KPIs that effectively monitor the required trends in the organization. This requires complete understanding of the objectives and requires proper communication channels between the analysts and those who are responsible for fulfilling the objectives.
There are a number of KPIs to choose from, but the success in monitoring relies on the right choice of those that are relevant to the objectives. The KPIs differ from organization to organization and from department to department and will be effective only when they lead to improvement in the performance.
You can evaluate the relevance of a KPI using the SMART criteria – i.e. the KPI should be Specific, Measurable, Attainable, Relevant and Time-bound. In other words, the KPI chosen should meet the following criteria −
The KPI reflects your Specific objective.
The KPI enables you to Measure progress towards that goal.
The goal for which the KPI is being defined is realistically Attainable.
The goal that the KPI is targeting is Relevant to the organization.
You can set a time-frame for achieving the goal so that the KPI reveals how near the goal is as compared to the time that is left.
The defined KPIs are to be evaluated from time to time to find their relevance as the time progresses. If required, different KPIs need to be defined and monitored. Only then, your KPI monitoring will be relating to the current organization needs.
Based on the analysis needs, you have to choose the relevant KPIs, and examples include the following −
Sales department might use a KPI to measure monthly gross profit against projected gross profit.
Accounting department might measure monthly expenditures against revenue to evaluate costs.
Human resources department might measure quarterly employee turnover.
Business professionals frequently use KPIs that are grouped together in a business scorecard to obtain a quick and accurate historical summary of business success or to identify trends or to identify performance improvement opportunities.
The examples used in this chapter are indicative so as to help you in understanding how you can define and monitor KPIs in Excel. The sole discretion of identifying the KPIs lies with you based on the objectives so as to reflect the current scenario as compared to the targets.
KPIs in Excel
You can analyze performance against the set target with PowerPivot. For e.g., a PowerPivot KPI could be used to determine for each year and salesperson how his actual sales compared to his sales target.
You can explore and visualize the same KPI with Power View.
You can also define new KPIs and /or edit them in Power View.
You can produce aesthetic reports with KPIs in Power View.
Defining a KPI in Excel
The first step in KPI analysis is to define the identified KPI. This requires defining the three parameters for the KPI as follows −
Base Value
A Base Value is defined by a calculated field that resolves to a value. The calculated field represents the current value for the item in that row of the table. E.g., aggregate of sales, profit for a given period, etc.
Target Value/ Goal
A Target Value (or Goal) is defined by a calculated field that resolves to a value, or by an absolute value. It is the value against which the current value is evaluated. This could be a fixed number, for example, average number of sick-leave days that is applicable to all the employees, or a calculated field, which results in a different goal for each row, for example, budget of each department in the organization.
Status
Status is the indicator of the value. It would be striking if you set it as visual indicator. In Power View in Excel, you can edit the KPI, choosing which indicators to use and what values to trigger each indicator.
For example, suppose you want to monitor the Sales targets of the Salespersons in an organization who are selling a product. The objective of the analysis is to identify the best performers who are meeting the target Sales Amount. You can proceed to define the KPI as follows −
Base Value − Current Value of the Sales Amount for each salesperson.
Target Value / Goal − This is fixed for all the salespersons so as to enable comparison between the salespersons. Assume that the Target Sales Amount is 3500. Note that for a different analysis you could vary the target values for the salespersons.
Status − The Status is to be displayed with a graphic to easily determine the status of the Base Value compared to the Target Value.
KPIs in PowerPivot
You can define KPIs in PowerPivot as follows −
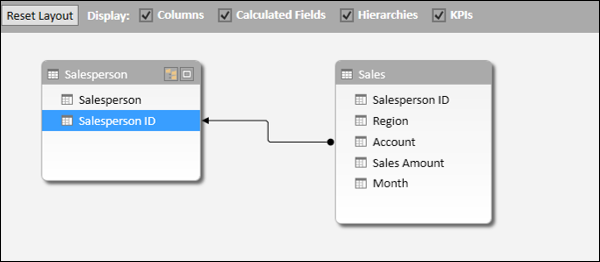
- Start with two tables SalesPerson and Sales.
- SalesPerson table contains SalesPerson ID and SalesPerson Name.
- Sales table contains the sales information salesperson-wise and month-wise.
- Add the two tables to Data Model.
- Create a relationship between the two tables using the field SalesPerson ID.
To set the Base Value, you need a calculated field for Sales Amount.
Add the calculated field in the Sales table for Sales Amount column in the Data Model as follows −
Total Sales:= sum([Sales Amount])
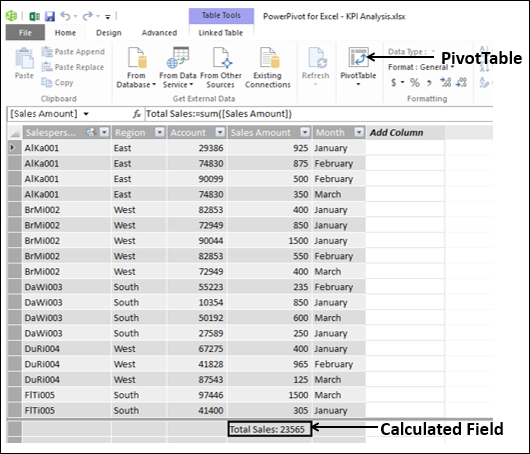
- Click on PivotTable on the Ribbon in the PowerPivot window.
- Select New Worksheet in the Create PivotTable dialog box.
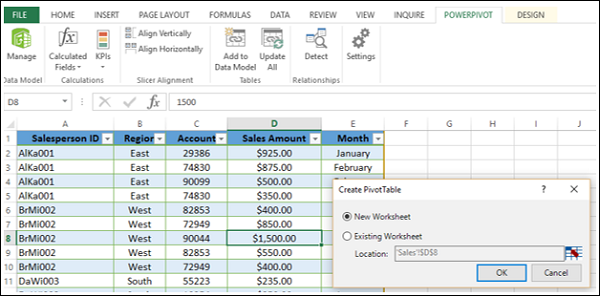
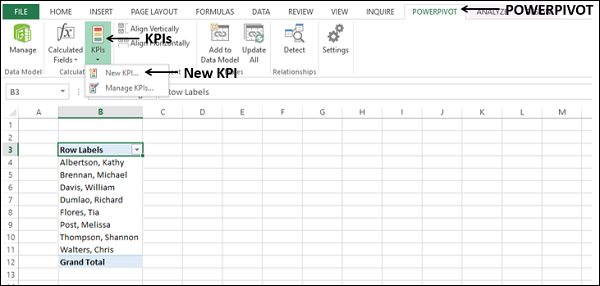
- Add the field Salesperson to ROWS area in the PivotTable.
- Click on the POWERPIVOT tab on the Ribbon.
- Click on KPIs in the Calculations group.
- Click on New KPI in the dropdown list.
Key Performance Indicator (KPI) dialog box appears.
Select Total Sales in the KPI base field (value) box.
Under KPI Status, have the following options −
Under Define target value, select Absolute value and type 3500 in the box.
Under Define status thresholds, adjust the vertical bars representing the percentages to 40 and 80.
Under Select icon style, select the first option.
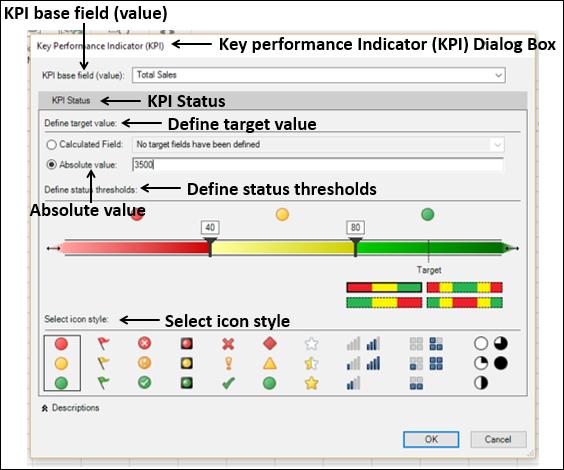
Click on the OK button. You can observe the following in the Sales table in PivotTable Fields list −
Total Sales field is a KPI and is depicted by the icon
 .
.The three KPI parameters – Value, Goal and Status appear as fields under Total Sales KPI.
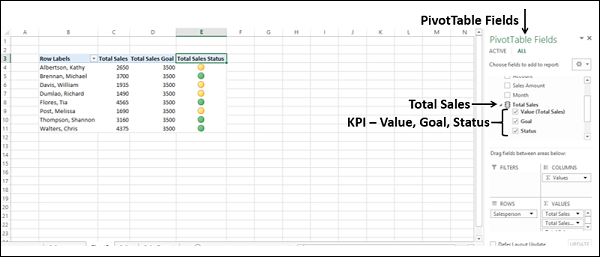
Select the three KPI parameters – Value, Goal and Status under Total Sales.
The three columns appear in the PowerPivot, with the Status column displaying the icons as per the corresponding value.
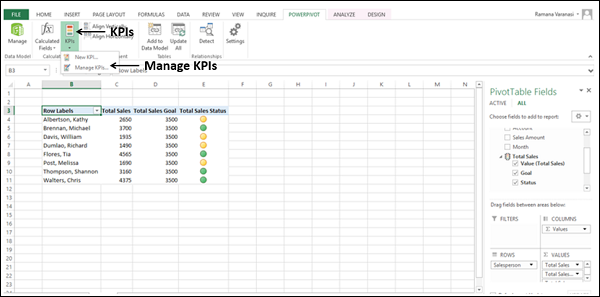
You can also define the KPI thresholds by values instead of percentages. To modify a defined KPI, proceed as follows −
- Click on KPIs in the Calculations group on the Ribbon.
- Click on Manage KPIs in the dropdown list.
Manage KPIs dialog box appears.
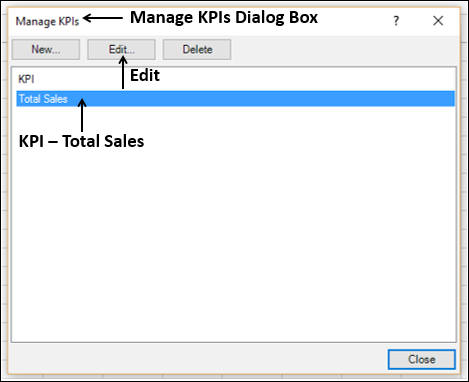
- Click on the KPI – Total Sales.
- Click on the Edit button.
Key Performance Indicator (KPI) dialog box appears.
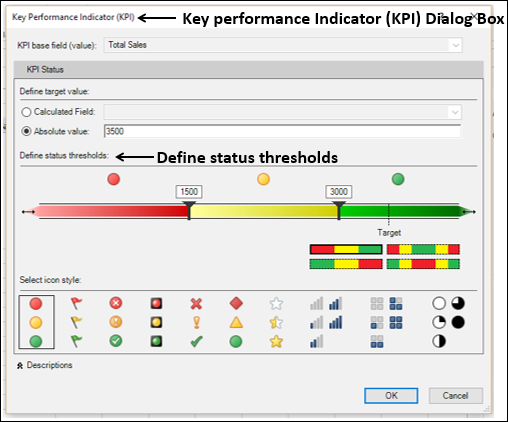
- Under Define status thresholds, adjust the vertical bars to 1500 and 3000.
- Retain the rest of the earlier options.
- Click on OK.
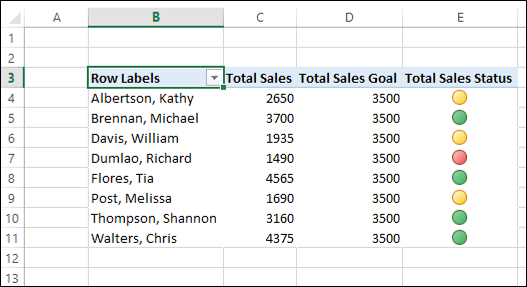
As you can observe, the status icons reflect the changed thresholds.
KPIs in Power View
You can create aesthetic reports with KPIs in Power View. You can either use the prior defined KPIs in Data Model or you can add KPIs in Power View.
To add or edit a KPI in Power View, proceed as follows −
- In the Power View Sheet, click on the PowerPivot tab.
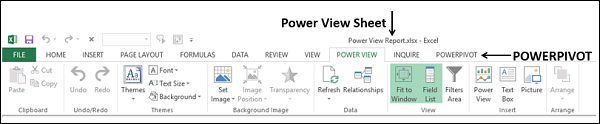
The PowerPivot Ribbon appears, which you had used in the previous section.
- Click on KPIs in the Calculation group.
- Click on New KPI to add a KPI.
- Click on Manage KPIs to edit a KPI.
The steps are the same as in the previous section.
You can create an aesthetic report of Sales Performance with KPIs in Power View as follows −
- Click on DATA tab on the ribbon.
- Click on Power View in the Reports group.
Power View sheet appears.
Add a Table with the fields – Salesperson, Total Sales and Total Sales Status.
Add a second Table with the fields – Salesperson, Total Sales and Total Sales Goal.
Convert the second Table to 100% Stacked Bar.
Add a third Table with the fields – Salesperson, Region, Total Sales and Total Sales Status.
Convert the third Table to Card. Drag the field Region to Tile By.
Add the Title – Sales Performance.
Change the font.
Increase the Text Size.
Resize Table, 100% Stacked Bar and Card appropriately.
Your Sales Performance report is ready −
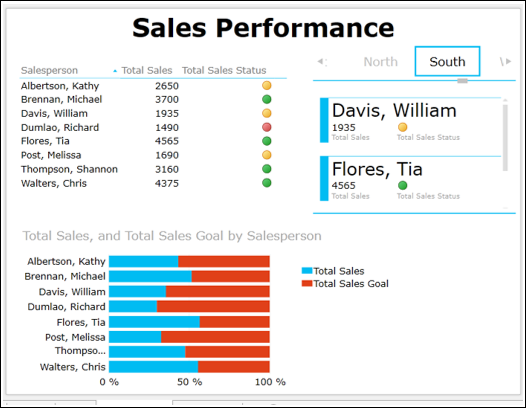
As you can observe, in the Power View you could portray the results as follows −
Table with icons for KPI status is similar to the PowerPivot report.
100% Stacked Bar depicts the percentage achieved with respect to the Goal. You can also notice that it gives a clear comparison of the performance of all.
Card depicts the KPI status of the Salespersons along with the Region they belong to. You can interactively scroll through the Tiles to display results for different Regions that would give scope to assess performance region-wise also.