- Excel Dashboards Tutorial
- Excel Dashboards - Home
- Introduction
- Excel Features Create Dashboards
- Conditional Formatting
- Excel Charts
- Interactive Controls
- Advanced Excel Charts
- Excel PivotTables
- Power PivotTables & PivotCharts
- Power View Reports
- Key Performance Indicators
- Build a Dashboard
- Examples
- Excel Dashboards Useful Resources
- Excel Dashboards - Quick Guide
- Excel Dashboards - Resources
- Excel Dashboards - Discussion
Key Performance Indicators
Key Performance Indicators (KPIs) are quantifiable measurements for assessing what is achieved against the set goals/ targets /business objectives. In dashboards, KPIs necessarily will have a position to display visually where a person / department / organization stands currently compared to where it is supposed to be.
Examples of KPIs include the following −
Sales department of an organization might use a KPI to measure monthly gross profit against projected gross profit.
Accounting department might measure monthly expenditures against revenue to evaluate costs.
Human resources department might measure quarterly employee turnover.
Business professionals frequently use KPIs that are grouped together in a business scorecard to obtain a quick and accurate historical summary of business success or to identify trends.
Dashboards either viewed publicly or selectively present continuously monitored KPIs and hence are chosen as the best monitoring and reporting tools.
Components of a KPI
A KPI essentially contains three components −
- Base Value
- Target Value / Goal
- Status
Though it is the Status that one would be interested in, the Base Value and Target Value are also equally important as a KPI need not be static and can undergo changes as the time proceeds.
In Excel, Base Value, Target Value and Status are defined as given in the following sections.
Base Value
A Base Value is defined by a calculated field that resolves to a value. The calculated field represents the current value for the item in that row of the Table or Matrix. E.g. aggregate of sales, profit for a given period, etc.
Target Value
A Target Value (or Goal) is defined by a calculated field that resolves to a value, or by an absolute value. It is the value against which the current value is evaluated. This could be one of the following −
A fixed number that is the goal all the rows should achieve. E.g. Sales target for all the salespersons.
A calculated field that might have a different goal for each row. E.g. Budget (calculated field), department-wise in an organization.
Status Thresholds and Status
Status is the visual indicator of the value. Excel provide different ways of visualizing Status as against Target Value.
You can use Bullet chart to visualize KPIs. You can illustrate the status thresholds by shaded regions of a column and the status as a column superimposed on the status thresholds.
You can define and visualize KPIs in Power View also.
Defining KPIs in Excel
To define a KPI, you need have the following in place −
- Base Value
- Target Value
- Status Thresholds (e.g. Poor, Good, Excellent)
For example, to define a KPI to monitor sales performance, you need to do the following −
Identify the cell(s) that contain the calculated values of total sales. This is for Base Value.
Define Target Value that can be absolute or varying.
Define the Status thresholds that help you visualize the Status.
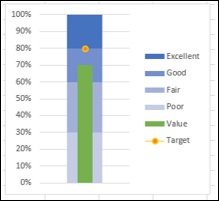
Visualizing KPIs with Bullet Charts
You can visualize KPIs with Bullet charts, in which the following will be clearly depicted.
- The Target
- Status Thresholds
- The Value (Status)
Visualizing KPIs with Power View
You can visualize KPIs that are defined in Power View using icons.
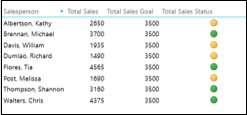
You can also produce an aesthetic report in Power View with the KPIs that can be included in your dashboard.
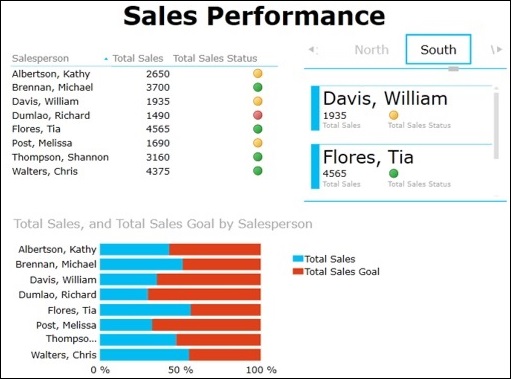
As you can observe, in the Power View you could portray the results as follows −
Table visualization with icons for displaying KPI status.
100% Stacked Bar Chart visualization depicting the percentage achieved with respect to the Goal. You can also notice that it gives a clear comparison of the performance of all the Salespersons.
Card visualization depicting the KPI status of the Salespersons along with the Region they belong to. You can interactively scroll through the Tiles to display results for different Regions that would give scope to assess performance region-wise also.