- Elasticsearch Tutorial
- Elasticsearch - Home
- Elasticsearch - Basic Concepts
- Elasticsearch - Installation
- Elasticsearch - Populate
- Migration between Versions
- Elasticsearch - API Conventions
- Elasticsearch - Document APIs
- Elasticsearch - Search APIs
- Elasticsearch - Aggregations
- Elasticsearch - Index APIs
- Elasticsearch - CAT APIs
- Elasticsearch - Cluster APIs
- Elasticsearch - Query DSL
- Elasticsearch - Mapping
- Elasticsearch - Analysis
- Elasticsearch - Modules
- Elasticsearch - Index Modules
- Elasticsearch - Ingest Node
- Elasticsearch - Managing Index Lifecycle
- Elasticsearch - SQL Access
- Elasticsearch - Monitoring
- Elasticsearch - Rollup Data
- Elasticsearch - Frozen Indices
- Elasticsearch - Testing
- Elasticsearch - Kibana Dashboard
- Elasticsearch - Filtering by Field
- Elasticsearch - Data Tables
- Elasticsearch - Region Maps
- Elasticsearch - Pie Charts
- Elasticsearch - Area and Bar Charts
- Elasticsearch - Time Series
- Elasticsearch - Tag Clouds
- Elasticsearch - Heat Maps
- Elasticsearch - Canvas
- Elasticsearch - Logs UI
- Elasticsearch Useful Resources
- Elasticsearch - Quick Guide
- Elasticsearch - Useful Resources
- Elasticsearch - Discussion
Elasticsearch - Region Maps
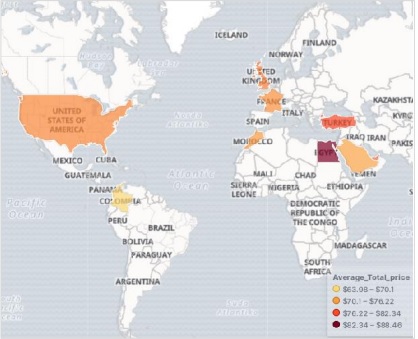
Region Maps show metrics on a geographic Map. It is useful in looking at the data anchored to different geographic regions with varying intensity. The darker shades usually indicate higher values and the lighter shades indicate lower values.
The steps to create this visualization are as explained in detail as follows −
Visualize
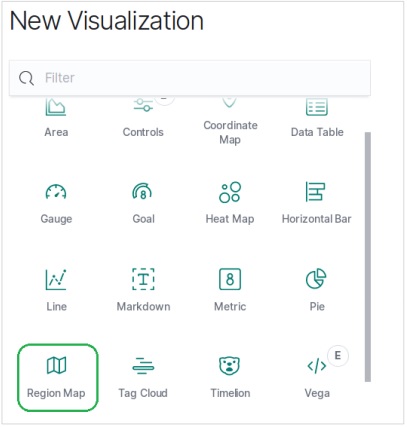
In this step we go to the visualize button available in the left bar of the Kibana Home screen and then choosing the option to add a new Visualization.
The following screen shows how we choose the region Map option.
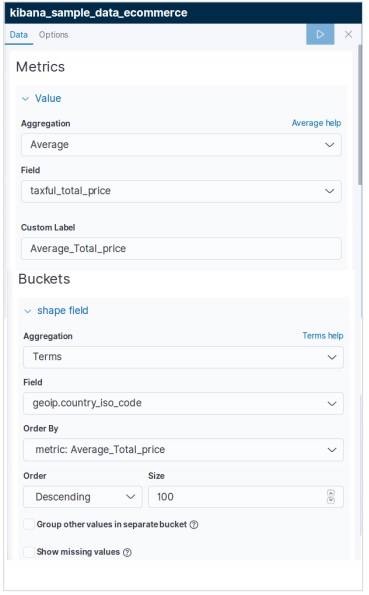
Choose the Metrics
The next screen prompts us for choosing the metrics which will be used in creating the Region Map. Here we choose the Average price as the metric and country_iso_code as the field in the bucket which will be used in creating the visualization.
The final result below shows the Region Map once we apply the selection. Please note the shades of the colour and their values mentioned in the label.