- Data Mining Tutorial
- Data Mining - Home
- Data Mining - Overview
- Data Mining - Tasks
- Data Mining - Issues
- Data Mining - Evaluation
- Data Mining - Terminologies
- Data Mining - Knowledge Discovery
- Data Mining - Systems
- Data Mining - Query Language
- Classification & Prediction
- Data Mining - Decision Tree Induction
- Data Mining - Bayesian Classification
- Rules Based Classification
- Data Mining - Classification Methods
- Data Mining - Cluster Analysis
- Data Mining - Mining Text Data
- Data Mining - Mining WWW
- Data Mining - Applications & Trends
- Data Mining - Themes
- DM Useful Resources
- Data Mining - Quick Guide
- Data Mining - Useful Resources
- Data Mining - Discussion
Data Mining - Bayesian Classification
Bayesian classification is based on Bayes' Theorem. Bayesian classifiers are the statistical classifiers. Bayesian classifiers can predict class membership probabilities such as the probability that a given tuple belongs to a particular class.
Baye's Theorem
Bayes' Theorem is named after Thomas Bayes. There are two types of probabilities −
- Posterior Probability [P(H/X)]
- Prior Probability [P(H)]
where X is data tuple and H is some hypothesis.
According to Bayes' Theorem,
Bayesian Belief Network
Bayesian Belief Networks specify joint conditional probability distributions. They are also known as Belief Networks, Bayesian Networks, or Probabilistic Networks.
A Belief Network allows class conditional independencies to be defined between subsets of variables.
It provides a graphical model of causal relationship on which learning can be performed.
We can use a trained Bayesian Network for classification.
There are two components that define a Bayesian Belief Network −
- Directed acyclic graph
- A set of conditional probability tables
Directed Acyclic Graph
- Each node in a directed acyclic graph represents a random variable.
- These variable may be discrete or continuous valued.
- These variables may correspond to the actual attribute given in the data.
Directed Acyclic Graph Representation
The following diagram shows a directed acyclic graph for six Boolean variables.
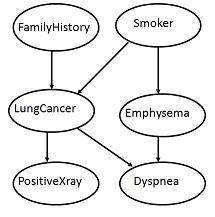
The arc in the diagram allows representation of causal knowledge. For example, lung cancer is influenced by a person's family history of lung cancer, as well as whether or not the person is a smoker. It is worth noting that the variable PositiveXray is independent of whether the patient has a family history of lung cancer or that the patient is a smoker, given that we know the patient has lung cancer.
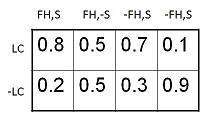
Conditional Probability Table
The conditional probability table for the values of the variable LungCancer (LC) showing each possible combination of the values of its parent nodes, FamilyHistory (FH), and Smoker (S) is as follows −