- Crystal Reports Tutorial
- Crystal Reports - Home
- Crystal Reports - Overview
- Crystal Reports - GUI Navigation
- Crystal Reports - Options
- Crystal Reports - Page Layout
- Crystal Reports - Getting Help
- Crystal Reports - Design Environment
- Crystal Reports - Data Sources
- Crystal Reports - Queries
- Query Filters & Filter Conditions
- Crystal Reports - Time Based Filters
- Field Objects Controls & Modifications
- Crystal Reports - Sections
- Crystal Reports - Delete Sections
- Crystal Reports - Groups
- Crystal Reports - Group Options
- Crystal Reports - Templates
- Crystal Reports - Inserting Objects
- Crystal Reports - Charts
- Crystal Reports - Cross Tab Layout
- Crystal Reports - Defining Formulas
- Crystal Reports - Formula Workshop
- Creating & Modifying Formulas
- Crystal Reports - Apply Boolean Formulas
- Crystal Reports - If-Then-Else
- Crystal Reports - Applying Calculations
- Crystal Reports - Conditional Formatting
- Crystal Reports - Creating Variables
- Crystal Reports - Creating Arrays
- Crystal Reports - Parameters
- Crystal Reports - Filters
- Crystal Reports - Prompt Panels
- Crystal Reports - Cascading Prompts
- Crystal Reports - Create Parameter Field
- Crystal Reports - Edit Parameter Field
- Crystal Subreports - Overview
- Crystal Reports - Data Export Overview
- Crystal Reports - Data Export to Excel
- Crystal Reports - Data Export to XML
- Crystal Reports - Data Export to HTML
- Crystal Reports - Data Export to CSV
- Crystal Reports Useful Resources
- Crystal Reports - Quick Guide
- Crystal Reports - Useful Resources
- Crystal Reports - Discussion
Crystal Reports - Quick Guide
Crystal Reports - Overview
SAP Crystal Reports is a Business Intelligence tool which is used to generate reports from both SAP and non-SAP data sources. It enables end users to generate reports that includes exceptional visualizations and implement new business requirements into reports to reduce dependency on IT and Report developers.
SAP Crystal Reports can connect to any data source that include Relational databases like Oracle, OLAP data source systems like BW, or also with XML data. You can create a simple report or you can also use complex or specialized tool of Crystal Reports to create advance level reports for end users. It is mostly used for pixel perfect reporting for CEO’s and Managers.
Benefits of Using Crystal Reports
Flexible and customized report − You can quickly create highly formatted, pixel-perfect reports using SAP Crystal Reports with high level design interface and efficient workflows.
Powerful report delivery options − You can deliver personalized reports to your business end-users in their preferred language and format.
Data source connectivity − You can connect to information sources directly. Data sources include: Native, ODBC, OLE DB, and JDBC connectivity to relational, OLAP, web services, XML, enterprise data sources, and salesforce.com.
Expanded support for Excel − You can take full advantage of the Excel file format by allowing more data to be exported to a single worksheet, without spanning multiple worksheets.
Windows operating system compatibility − SAP Crystal Reports software 2013 is certified compatible with Microsoft Windows 7.
Mobile compatibility − You can also open interactive reports through your mobile devices.
SAP Crystal Reports, Adobe Flash and HTML 5 integration − It enables SAP Crystal Reports developers to produce powerful "mash-ups" pulling data from various sources.
Competitors − SAP Crystal Reports competes with several products in Microsoft market like SQL Server Reporting Services SSRS, XtraReports, ActiveReports, and List & Label.
Installation Requirements for Crystal Reports
Following are the basic requirements to install Crystal Reports −
PC with AMD or Intel based processors, Dual Core CPU, 2 GB RAM
Approximately 4GB available hard drive space (for English only, 8 GB for all languages)
Microsoft Windows 7 SP1, Windows 8, Windows Server 2008 SP2, Windows Server 2008 R2 SP1, Windows Server 2012
Languages available − English, Finnish, French, German, Hungarian, Italian, Japanese, Korean, Norwegian, Polish, Portuguese, Chinese simplified, Chinese traditional, Czech, Danish, Dutch, Slovakian, Slovenian, Spanish, Swedish, Thai, Turkish, Romanian, Russian
Technical Specifications
Hardware Requirements − Intel Pentium III or equivalent processor, minimum 512 MB RAM recommended
Disk Space − 2 GB for default installation with English language, 4 GB for default installation with all languages installed
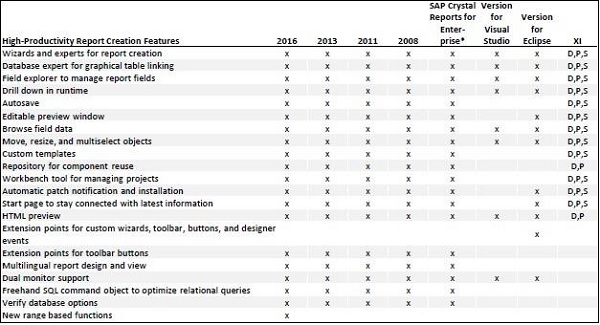
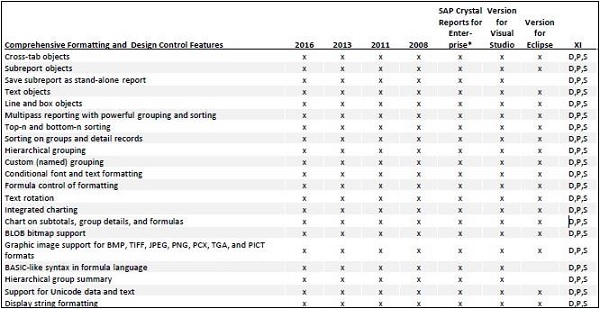
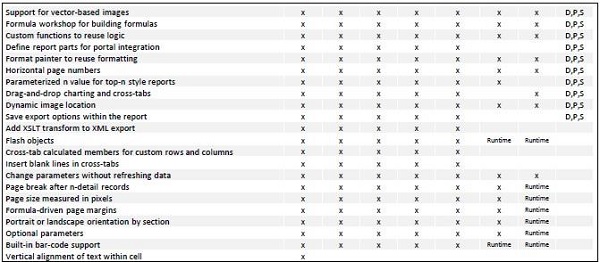
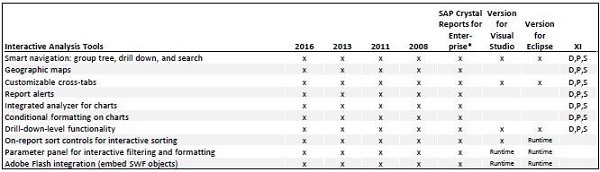
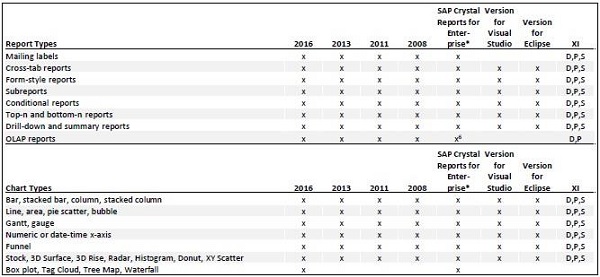
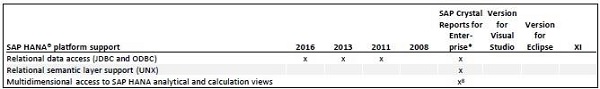
Versions and Features Comparison
Let us take an example to decode the SAP Crystal Reports version format. Assume 12.1.2.957.12 is the version of CR 2008. Here 1 signifies that it is Service Pack 1, .2 signifies that Fix Pack 1.2 has been applied on top of Service Pack 1. The last three of four digits are not important. Another example, if you have version 12.3.1.684, I know I am using CR 2008, Service Pack 3, Fix Pack 3.1.
Editions − Developer (D), Professional (P), Standard (S)
Editions − Developer (D), Professional (P), Standard (S)
Editions − Developer (D), Professional (P), Standard (S)
Editions − Developer (D), Professional (P), Standard (S)
Crystal Reports - GUI Navigation
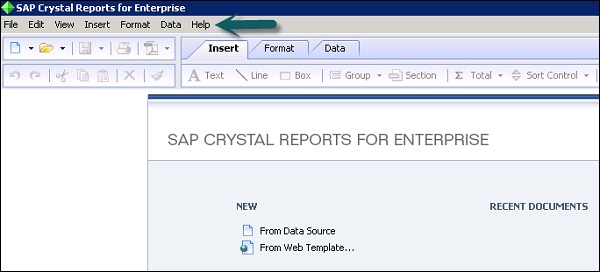
Crystal Reports for enterprise provides an interface that enables you to quickly and easily create, format, and publish effective reports.
The menu bar provides full range of features available in Crystal Reports for Enterprise as shown in the following image.
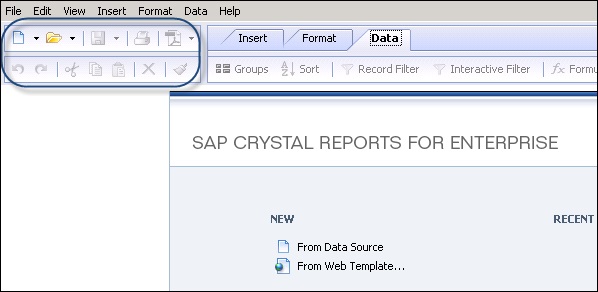
The standard toolbar as shown in the following image allows you to access common Report functions such as − Open an existing report, create a new report, save a report, print a report, cut, paste, export and undo.
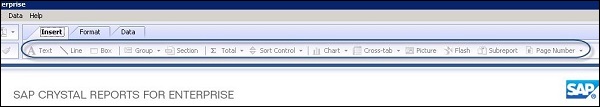
The Insert tab allows you to insert objects into you report, such as inserting a text, line, box, groups, sections, pictures, calculations and/or charts, as shown in the following image.
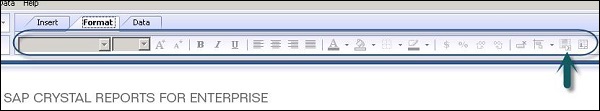
The Format tab as shown in the following image, allows you to use functions for formatting the selected field such as − changing the font size or font color, background color, alignment of text to center, left, right, etc.
It also allows you to apply conditional formatting, such as highlighting values above or below a specific threshold value in the report.
When you click on conditional formatting option at top right corner, the formatting box open. In this box, you define the condition under which you want conditional formatting to appear. In setting area, specify the formatting to appear when condition is met, like changing font style or color of text.
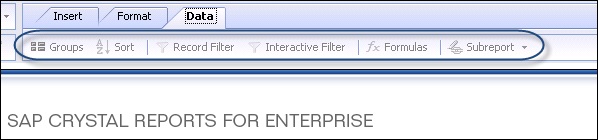
The Data tab as shown in the following figure, enables you to work with data-editing queries, creating groups and sorts, applying filters to limit data in the report and creating formulas to add custom calculations to reports.
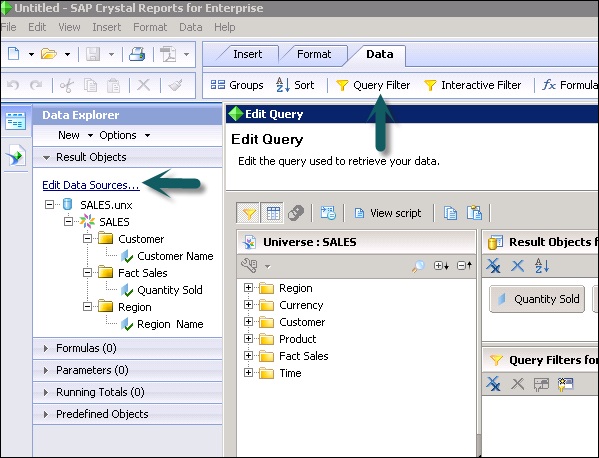
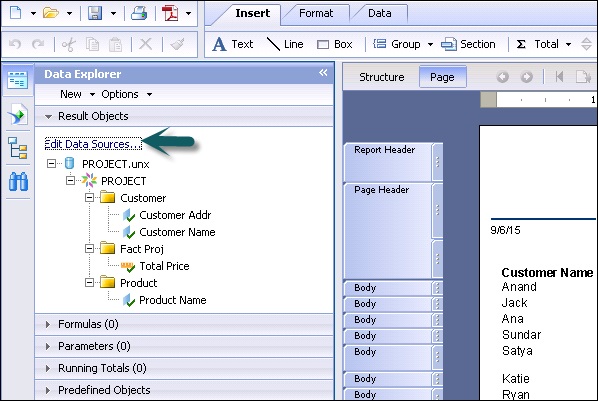
When you click on Query filter option or on Edit data sources, as shown in the following image, a query panel opens. In the Query panel, you can select objects that you want to see in the report. In the filter option, you can apply filters to restrict the data returned by the report.
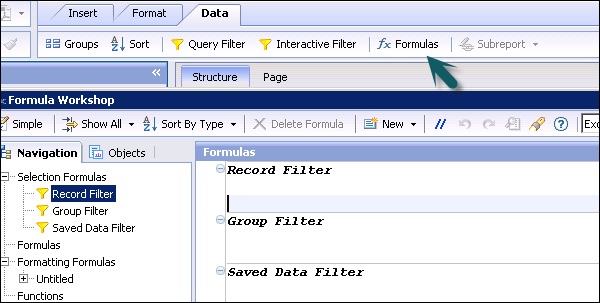
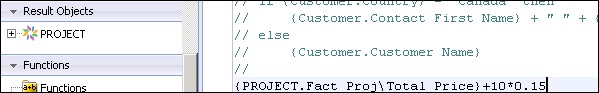
When you click on Formula button, as shown in the following image, the Formula workshop opens. This allow you to use custom calculations in the report. You can apply formulas by typing or by clicking on objects, functions and operators in the data explorer.
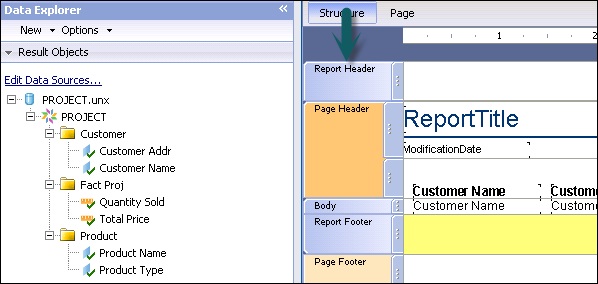
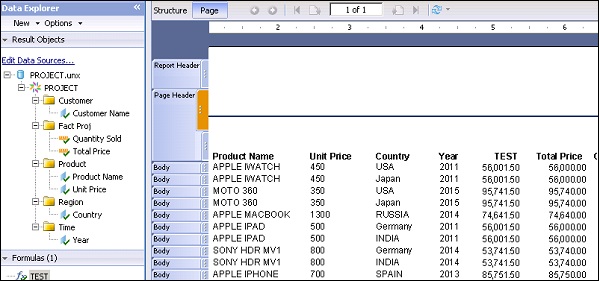
The main working area in Crystal Reports is known as Report Design Canvas and is divided into structure tab and page tab. Crystal Report is divided into five different parts by default and additional sections are added if you apply grouping to the report.
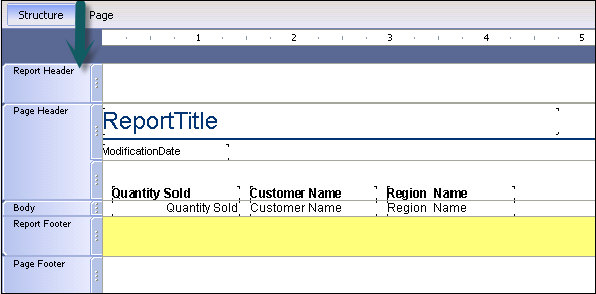
Using the Structure tab, as shown in the above image, you can create the overall structure by placing items in various sections of the report. You can also apply any required sorting, grouping, etc. Here, you work with placeholders for data and not data itself.
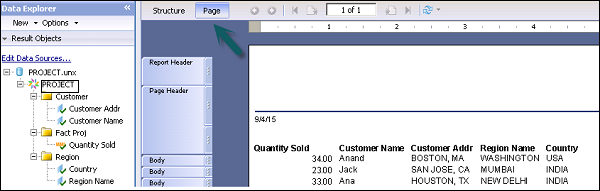
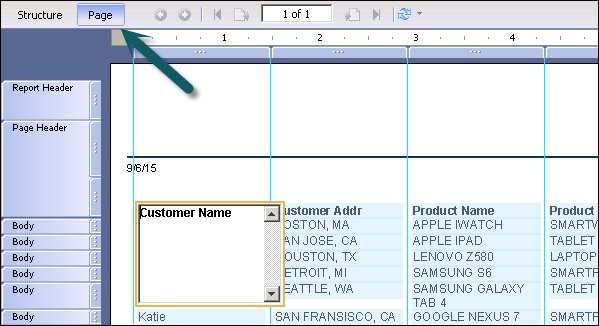
The Page tab, as shown in the following image, displays the report data on the basis of the structure you created in the structure tab. Here, you can evaluate formatting and layout of the report design for distribution.
Crystal Reports - Options
Report Options is one of the most commonly used feature in Crystal Report Designer, when you need to access/modify the values of Report Options of a Crystal report at runtime in a Crystal Reports .NET application.
Go to Edit → Report Options
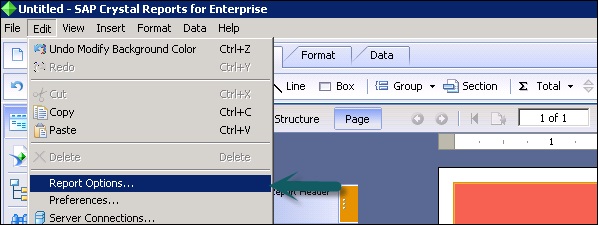
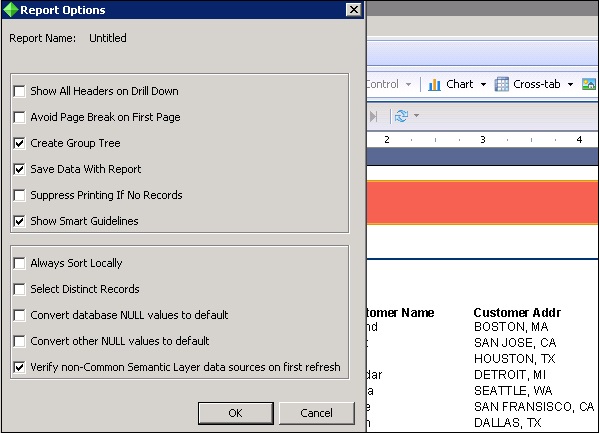
Report Options feature is used to set various fields in a Crystal Reports such as, smart guidelines feature that lets you select, move, and resize entire columns of report elements without needing to manually select each element. When you select a report element, the smart guidelines appear and automatically select related elements in the column.
Crystal Reports - Page Layout
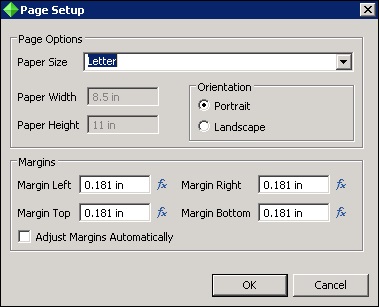
SAP Crystal Report gives two options of page layout - landscape and portrait. Landscape means the page is oriented horizontally, while portrait means the page is oriented vertically.
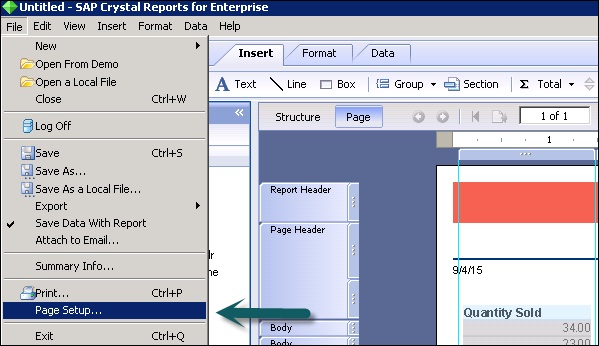
To open Page Layout option in Crystal Report, go to File → Page Setup.
This option allows you to choose page options like: Paper size, paper width, paper height, and margins (left, right, top and bottom).
To change the page layout −
Select the Page Setup tab in File Menu. Click the Orientation option in the Page Setup group.
Crystal Reports - Getting Help
SAP Crystal Report for Enterprise help tab provides all the study material and interactive videos link from SAP site to learn Crystal Report features.
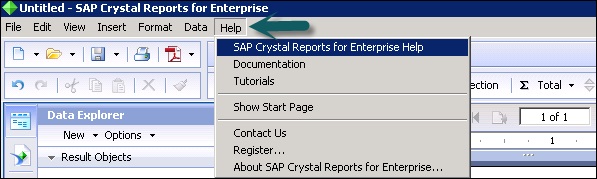
The following options as shown in the image, are available when you click on Help tab in menu bar −
- SAP Crystal Reports for Enterprise Help
- Documentation
- Tutorials
- Show Start Page
- Contact Us
- Register
- About SAP Crystal Report for Enterprise
SAP Crystal Reports for Enterprise Help
This options provides you with a complete guide titled Introduction to SAP Crystal Report for Enterprise as shown in the following image.
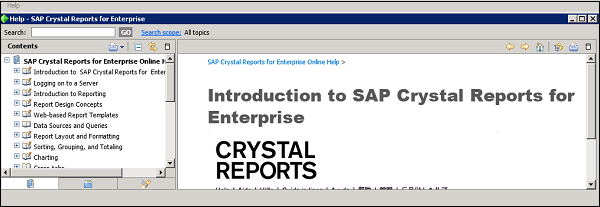
This covers an introduction to Crystal Reports Enterprise 4.x and all basic reporting functions available in the tool like logging on to a server, introduction to reporting, design concepts, data sources and queries, charting, etc.
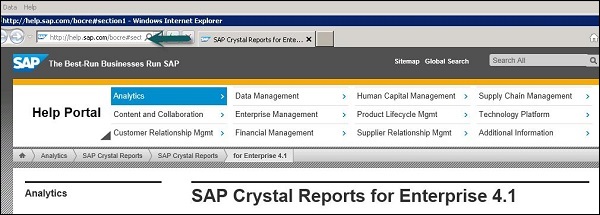
Documentation
When you click on documentation option in Help tab, it takes you to SAP link for Crystal Report for Enterprise 4.x.
This link has Crystal Report for Enterprise 4.x guides for −
- Installation, Upgrade and Deployment
- End Users guide
- Additional Information
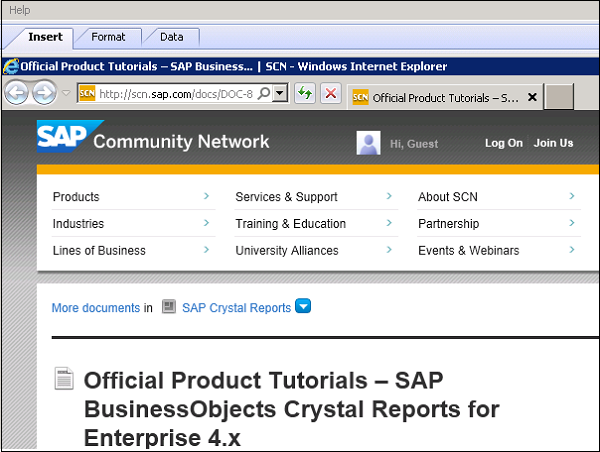
Tutorials
When you click on Tutorials link in Help tab, it takes you to the Official Product Tutorials – SAP BusinessObjects Crystal Reports for Enterprise 4.x
This page provides eLearning material which includes interactive sessions and video tutorials on all key features of the tool.
Start Page
It takes you to the homepage of SAP Crystal Reports Enterprise 4.1 tool. Contact Us and Register Option are used to contact SAP for any tool related features.
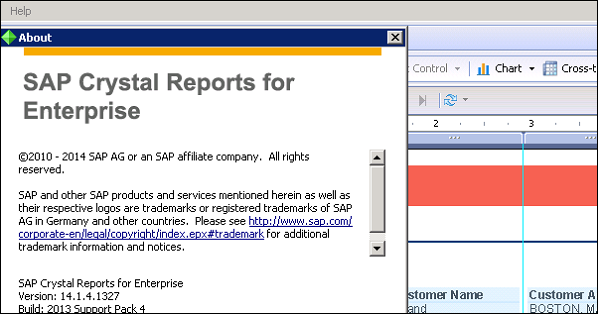
About SAP Crystal Report for Enterprise
It takes you to the About page of the tool that has Versions and Build details.
Crystal Reports - Design Environment
SAP Crystal Report design environment provides you the area where you can design the structure of the report. It consists of multiple components −
Report Design Canvas
The Report Design Canvas is used to design the structure of your report. You can place various elements like charts, test elements, and data objects in the report.
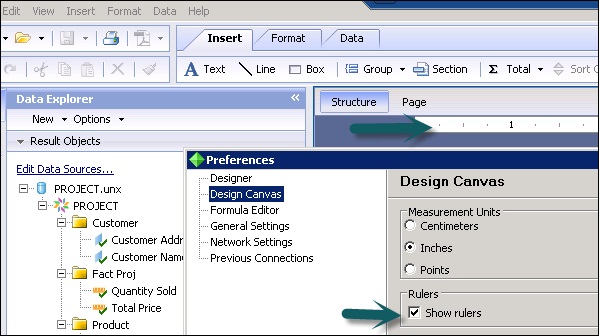
Show ruler option displays a ruler above the report canvas. You can change the unit of measurement by changing the measurement unit option on design canvas tab.
Structure mode and Page mode are available to define the layout of the report. Structure mode shows the structure of the report and Page mode is used for previewing the report.
Edit → Preference → Design Canvas
Structure Mode
Structure mode is used to provide an environment for designing the report. It provides a structure and instructions for creating the report. When you place an object in the report, it is shown in Structure mode. You can add/delete objects or apply complex formulas or you can also move the objects.
Each object in Structure mode is represented by a frame. Structure mode has multiple components that can be used to edit the report −
Report Header
It is used to add Report title at the top or any other information you want to place at the beginning of the report.
Page Header
This option is used to present information at the top of each page like document heading, chapter name, etc. Page header doesn’t come in Report Header.
Body
This is used to show the body of the report. All report data comes in this section.
Report Footer
This is used to present information at the end of the report like totals, etc.
Page Footer
This is used to present page numbers or any other information you want at the end of each page.
Page Mode
It represents the actual data in the report when the report is published or printed. It also allows you to change the formatting of the report with actual data and changes are immediately visible in the report.
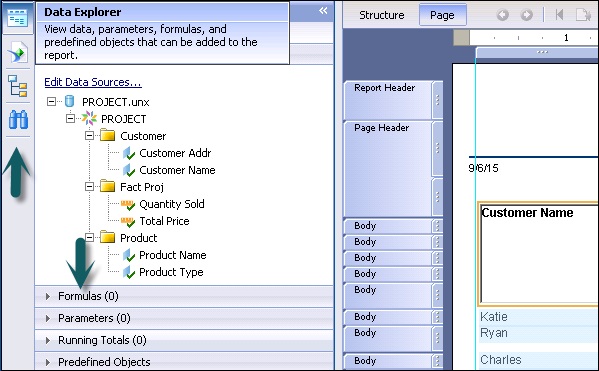
Data Explorer Side Bar
It is used to add/delete objects in the report. When you create a new report or open an existing report, this side panel opens itself.
All the objects that are added in the query panel are shown under data explorer and from here you can add objects to the report. This is further divided into the following components −
Result Objects
It shows all the objects that has been added to the report. You can also drag the objects to add in the report. Edit Data Sources option enables you to add new objects from the Universe or to choose a new Universe/Data Source from the repository.
Formula
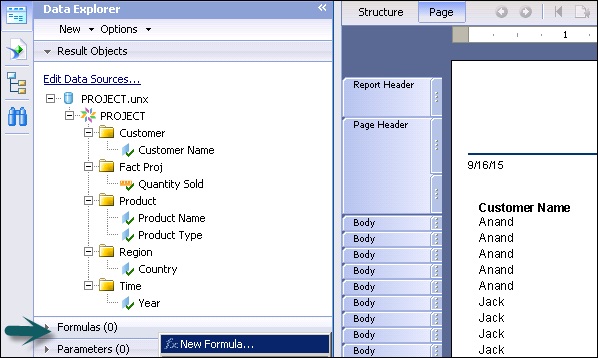
This shows all the formula that has been created for the report. You can create new formula with a right click on Formula tab and → New → New Formula.
You can also drag formulas to the report.
Parameters
It shows all the parameters that has been created for the report. You can create new parameter group with a right click on Parameter → New → New Parameter.
Running Totals
It shows a list of all running totals that has been created for the report. You can create new running totals with a right click on tab → New Running Total.
Predefined Objects
It shows the predefined objects that can be added to a report. You can drag predefined objects to report canvas to add them to the report.
Outline
It is used to see the tree structure of the report. The first node in tree structure represents the report itself, the first level node represents the sections in the report, and each section containing objects are listed.
Group Tree
It is used to see tree view of all groups and subgroups in the report.
Find
It is used to search a specific value in the report. Type a word in the search box to find any value.
Crystal Reports - Data Sources
Crystal Report can connect to multiple data sources that includes −
- Universe
- SAP BEx Query
- Relational Connection
- HANA view
- Excel Spreadsheets
To connect to a Data source, go to File → New → From Data Source
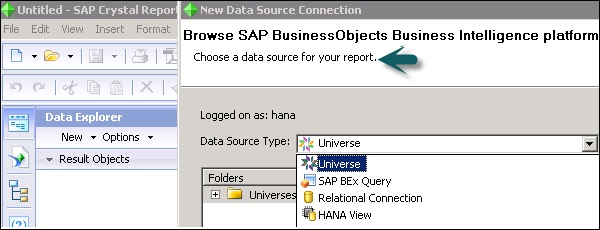
To select a data source you must be connected to SAP Business Objects platform server.
When you go to File → New → From Data Source → Choose a data source connection dialogue box appears → Browse Repository → Data Source Type list → Select data source you want to connect → Next.
If you choose a Universe, a query panel opens and you can add objects to query filter to generate a report.
Crystal Reports - Queries
SAP BEx and Universe data source connections allow you to create and design query in Crystal Reports.
Create Queries
To create a query in Universe you can choose both OLAP and Relational data sources.
First step in a query design is to define objects that you want to add in your query. You can also refine your query by applying sorts and query filters. Query panel is divided into multiple panes −
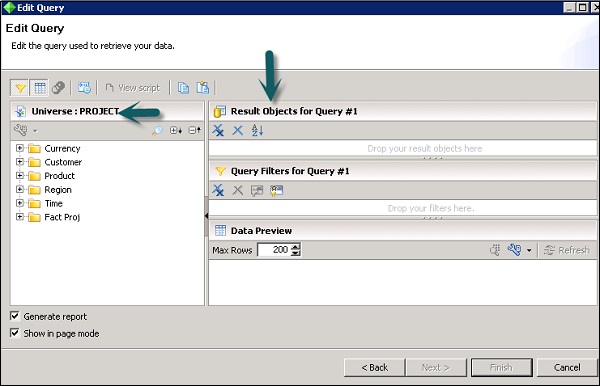
Universe Pane
It contains a tree structure of all the objects in Universe. You can see all the objects in Universe by using Expand All option.
You cannot add new objects or edit existing objects in query panel.
Result Objects Pane
In this area, you add objects that you want in your query.
Query Filter Pane
This is used to filter the value of objects in the report. You can use predefined filters or can create custom filters by adding objects.
SAP BEx queries can contain one or more hierarchies and predefine objects to run the report.
SAP HANA queries include data from SAP HANA Modeling views: Analytic, Calculation Views. To connect to HANA database and to use Schemas → tables inside the database, you can use an existing Relational or OLAP connection. A Relational connection can be created in IDT tool.
An OLAP connection can be created in CMC as well as in Information Design tool. HANA multi-dimensional views can be connected to Crystal Reports using an OLAP connection.
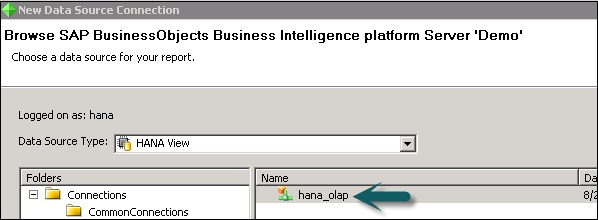
Click on Next → It will show you list of all Modeling views inside HANA repository → Select a Modeling View → Finish
It will open objects of view in a query panel, which can be used to add them to the report.
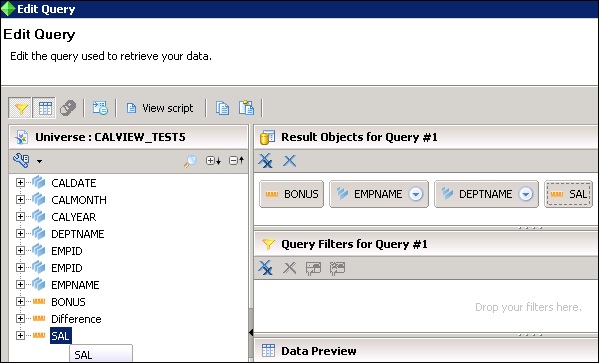
Editing a Query
Once the Crystal Report is created using a query, to make changes to objects you have to go to edit data source option. When you click on the option, it will open an Edit Query panel where you can add/delete objects, apply filters, etc.
You can also edit an existing query by going to Data → Edit Data Sources as shown in the following image.
Once you are done with the changes, click on Finish and all changes will be applied to data in Crystal Report.
Query Filters & Filter Conditions
Following are the types of query filters that can be used in Crystal Reports −
- Predefined filters
- Custom Filters
- Custom Filters
Predefine Filters
These are inbuilt filters in query panel created by the administrator. Predefined filters are created at the Universe level and are directly used in the report from the Universe. Drag an object on which you want to apply filter to query filter pane and drag predefined filters too. When you run the query data w.r.t query filter will be returned in the report.
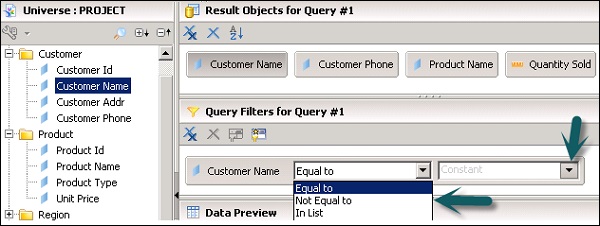
Custom Filters
These filters are created with the queries in the query panel. Custom filters are created in the Query panel under the query filter tab. Drag the object to the query filter pane and make use of various relational operator to pass the filter condition. You can put a constant value or a list of values in the query filter.
Prompts
They are used to display a question or list of values and are known as dynamic filters.
Filter Condition
Constant option allows you to enter a single value in filter.
List of values allow you to choose one value from all the available values for an object.
Prompt is used to pass dynamic value to a query filter.
| Option | Description |
|---|---|
| Constant |
|
| LOV |
|
| Prompt |
|
Crystal Reports - Time Based Filters
Time based query filters are used to filter the value of specific objects between certain periods of time. When you add a date dimension to query filter, you can use between operators from drop down list to specifically mention to and from date.
You can click on calendar option to select dates in ‘to’ and ‘from’ fields. You can also use Date dimension with the list of values (LOVs) or Constant value option. LOVs allow you to select to and from date from the list of values available for Date dimension in the Universe.
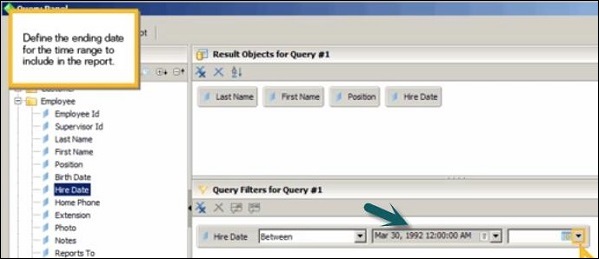
This is known as applying Time based filters in the report.
Field Objects Controls & Modifications
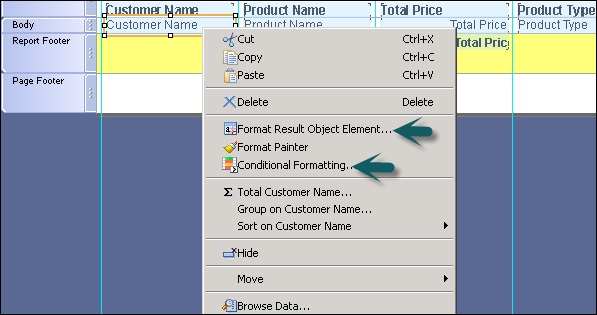
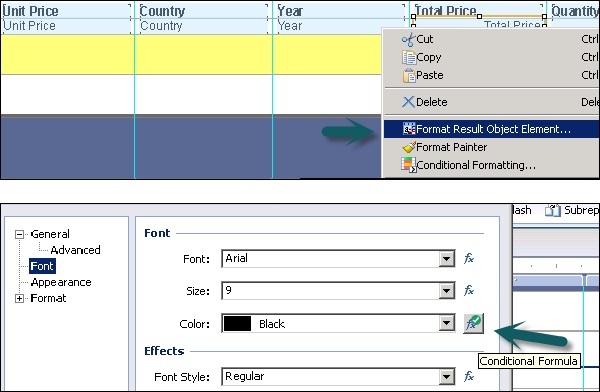
Field objects controls are used to edit the object in the report. To edit the object, you can right click on the object name and select ‘Format result Object Element’ or ‘Conditional Formatting’ option as shown in the following image.
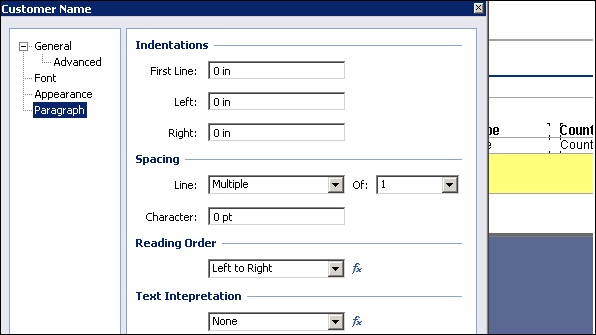
Format Result Object Element field is used to change the appearance of the objects in the report. It has the following 4 tabs inside −
- General
- Font
- Appearance
- Paragraph
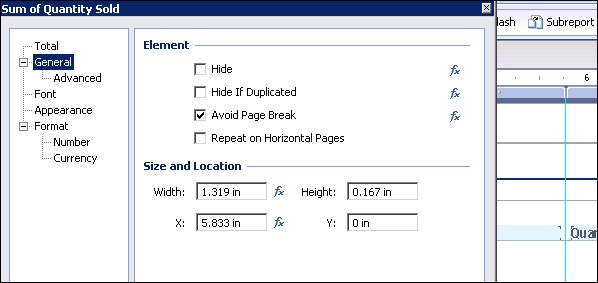
General tab is used to define generic properties of report objects: like height and width, hide and hide if duplicate, etc. Advanced tab in General is used to pass hyperlink in the report.
Font tab is used to change font size, color, style, alignment and rotation of object name in the report.
Appearance tab is used to change the border and to add effects to the report objects.
Paragraph tab is used to define line properties in case of multiple lines in the report.
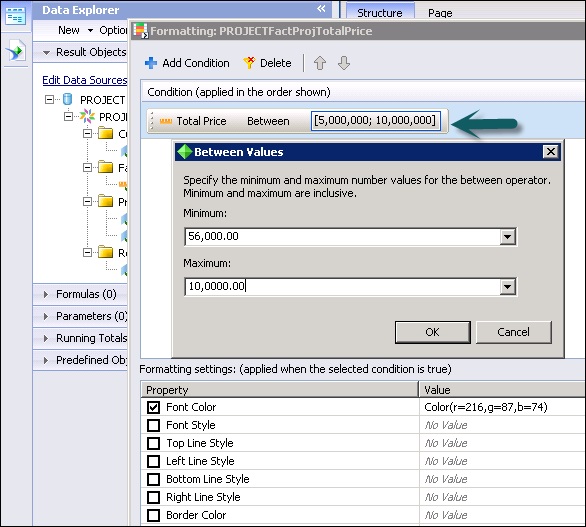
Conditional formatting is used to pass conditions for appearance of report objects.
You can pass the value of an object by clicking on Add condition tab → select object name and pass condition. You can define font style, font color, etc.
Crystal Reports - Report Sections
As discussed earlier, Crystal Reports by default provides five main sections −
- Report Header
- Page Header
- Body
- Report Footer
- Page Footer
Here, we will learn how to insert, hide, and delete sections in Crystal Report for Enterprise 4.x.
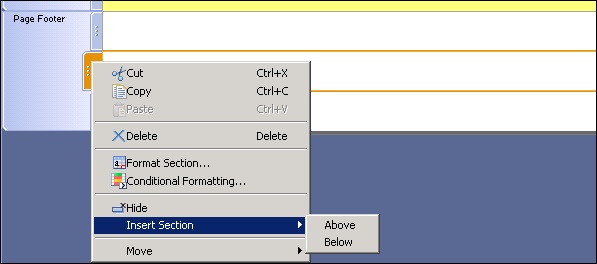
To insert a section in any of the report section, select the section → Right click and Insert.
You can use Hide and move option to hide a section or to move the section up and down.
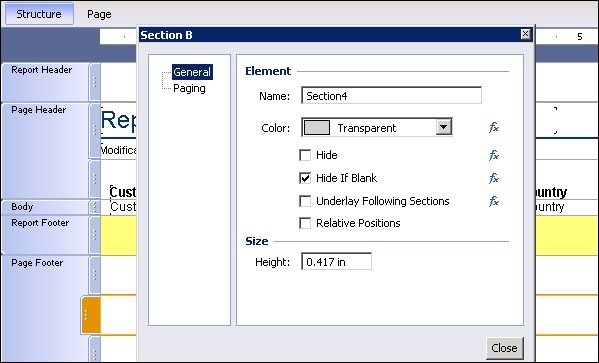
Format Section option allows you to format the section properties. It includes −
- Name
- Color
- Size
Size option allows you to adjust the height of the section.
To keep a section from breaking across pages −
If an element is longer than one page then it prints across multiple pages. To avoid this you can use Paging option.
Right click a section and click format section → Paging → Select Avoid Page Break and click Close.
Now let us see how to insert, hide and delete sections in Crystal Report 2013.
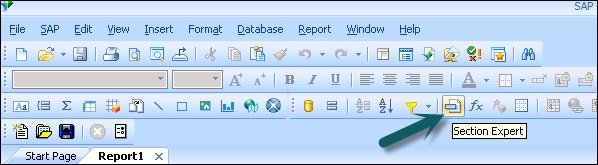
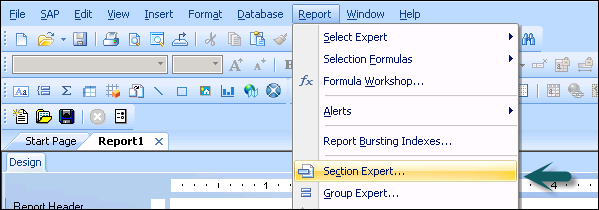
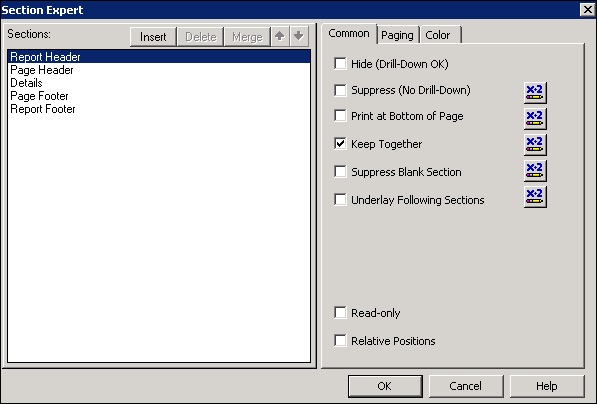
Section Expert as shown in the following image is used to manage sections in the report.
To insert a new section you need to −
Click Section Expert button as shown in the following image (Section Expert contains a list of all the sections in the report) → Select section and click insert.
A new section will appear in the report.
Crystal Reports - Delete Sections
To delete a section
Open Section expert at the top and select the section you want to delete → enter Delete.
You can only delete the section if they are lettered. You cannot delete sections originally provided by Crystal Reports.
To change the order
Open Section Expert →Select section you want to move and use up and down arrows to change the order of the sections.
To merge sections
Open Section Expert → Move sections you want to merge with each other → select the top section → Click merge.
Sections will be merged with the section that is next on the list.
To split sections
Click on the boundary of the section you want to split → Horizontal line that splits section will appear → Drag-and-drop to the place where you want to split the section.
Sorting Data
Sometimes you are required to sort data in Crystal Reports in a certain order. When you sort the data, it is easier to find specific records in the report. You can add a sort in ascending or descending order and it can also be applied to attributes and measures value.
You can also remove the sorting using delete option in Sort tab.
Let us see how to apply sort in Crystal Reports.
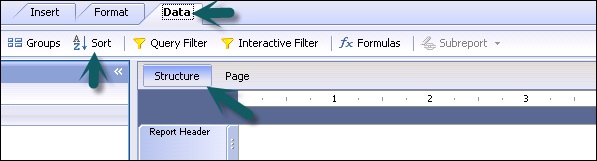
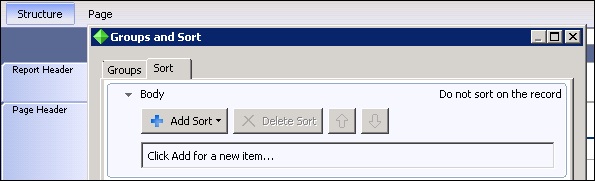
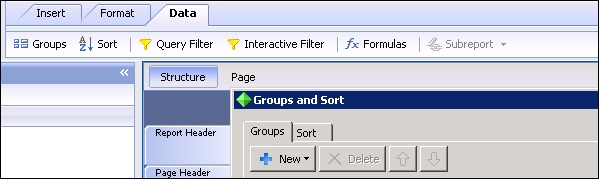
To apply a sort in Crystal Report for enterprise 4.x, go to Structure tab of the report → click on Data tab at top and choose sort.
When you click on sort option, it will pop-up a window with group and sort option.
Go to Sort tab and expand the body tab to apply sorting on measures and attribute values in the report.
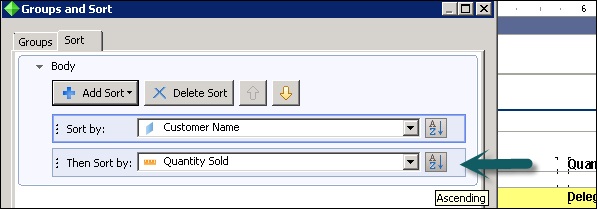
To add a sort, click on Add sort option. It will show you all the attributes and measures added to the report. Choose the object on which you want to apply sorting and click on ascending and descending option.
A → Z Ascending or Z → A Descending
You can also add multiple sort in a single report and click on OK.
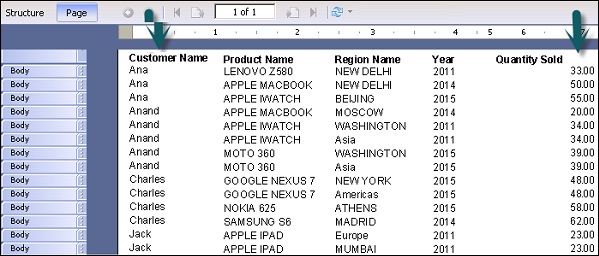
To view sorted data go to Page tab.
In the above example, it has applied a sorting on customer name and then Quantity sold.
To delete a sort, select the sort and click on delete sort option.
Crystal Reports - Groups
In this chapter, we will cover how to define, render and delete groups.
Define Groups
When you need to separate the data into groups in order to make it easily understood, grouping option can be used.
You can also customize grouping for a single value or multiple values by using the customize option inside the grouping tab.
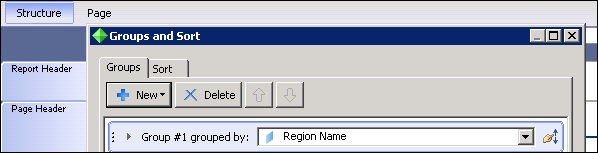
To apply grouping in the report, go to structure tab of the report → Data → Groups
Render Groups
To add a grouping condition. Click on New (‘+’ sign) and select the attribute on which you want to apply grouping. If you apply regular grouping on one object, it will group all the similar values in a report.
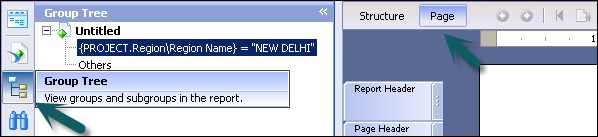
To apply grouping on single value, go to customize grouping option → New → Add Condition → select operator and value from the dropdown list as shown in the following image −
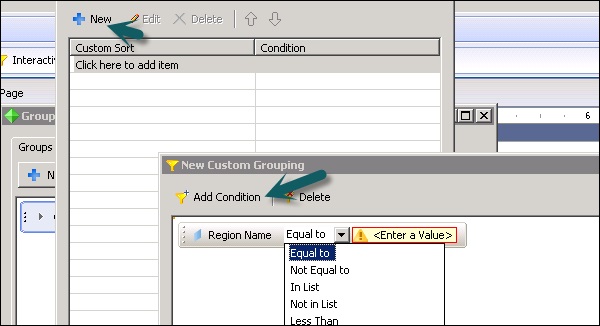
It also gives an option to discard everything else, group everything else in single group with group name or include everything else without changing the group name.
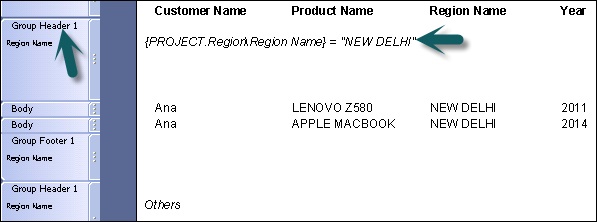
In the following example, it has created 2 groups: first with Region Name=”New Delhi” and second group with everything else with group name “Others”.
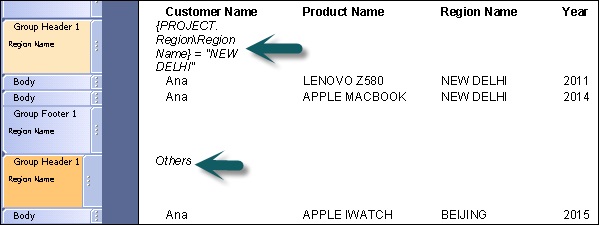
When you use grouping in a report, two new sections appear in the report canvas − Group Header 1 and Group Footer 1.
Delete Groups
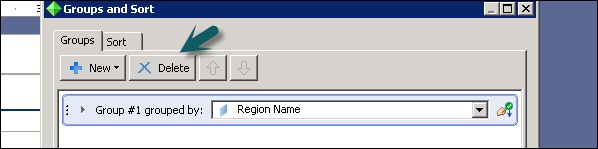
To delete a group, select the group you want to remove and click on the Delete option.
Go to Structure of the report → Groups → select groups #1, 2 you want to delete → Delete.
Crystal Reports - Group Options
You can use the following 3 options while customizing a group in Crystal Reports −
Discard everything else
Group everything else in a single group with a group name
Include everything else without changing the group name
Group Tree
When you are in Page tab, the group tree icon in side panel is used to see tree view of groups in the report. It allows you to jump to a specific group in the report instead of scrolling through the report looking for a specific group.
Live Headers in the Report
Live header changes based on the content of the group. When you define a group in the report, the program automatically inserts a group name in the element, in the group header section. This element displays the group’s name.
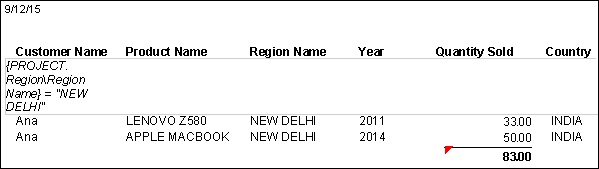
Totaling Grouped Data
The grouping of data in the report is done to find the total for each group in the report. Many totaling options are available − Sum, count, maximum, minimum, average, etc. You can also add subtotal to your report.
Total option in the report − Go to insert tab → Select options for your total
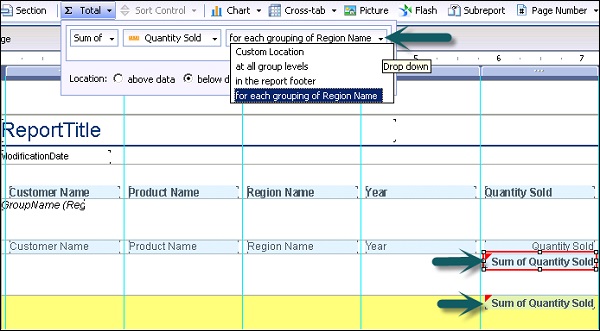
To change the format of the total box, right click on total value → format total.
Crystal Reports - Templates
Instead of creating a report from scratch, you can also use inbuilt templates from the report repository. These report templates provide predefined layout for common documents like purchase orders, invoices, letter templates, etc.
To select a Report template from the repository, go to File → New → From Web template
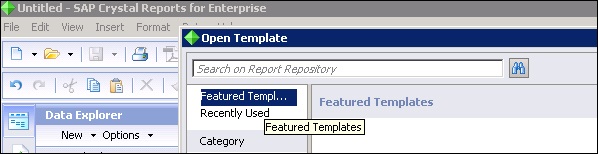
There are two template options in Crystal Reports −
- Featured Templates
- Recently Used
You can also perform a search using the search tool. Once you choose a report template you will be asked to select a data source.
Select Preview (To preview the report template before selecting data source)→ Set Data Source location to select a data source → Target Data Source panel, Add Connection icon → Choose a Data Source Connection dialog box appears.
Select your data source connection from one of the following options −
Previous Connections − This option lets you use previously connected data sources.
Browse Repository − This option lets you choose your data source from the Data Source Type list.
Connection by Vendor − This option connects to data sources sorted by a vendor or software provider.
Click Finish.
Select an object from the Current Data Source panel and connect it to an object in the Target Data Source panel → click on map → click on done.
Crystal Reports - Inserting Objects
Insert options in Crystal Reports for Enterprise allows you to add multiple objects at the report level: charts, crosstabs, picture, flash, sub-reports, etc.
Add Graphics Objects
You can add multiple format pictures in the report. It can also be used if you want to add company logos, brand name, etc. in the report.
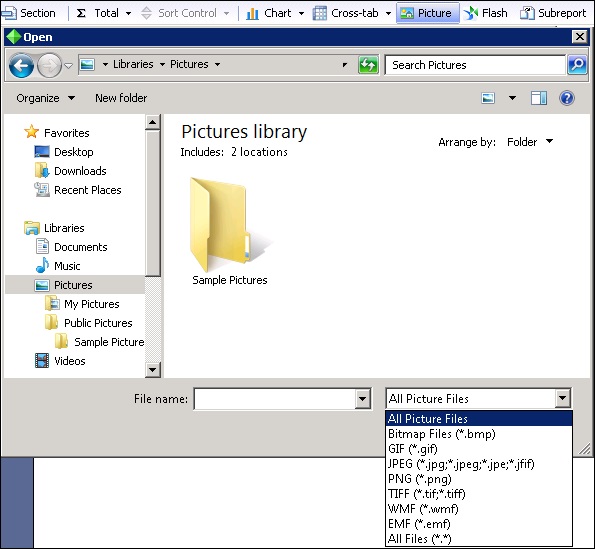
When you click on Picture, it gives an option to insert a picture in the report. The following common picture formats are supported in Crystal Reports −
- jpeg
- png
- gif
- tiff
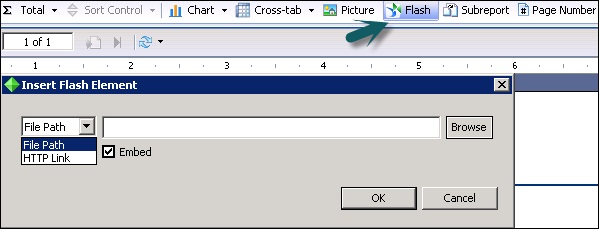
It also allows you to insert flash files in the report. When you click on flash, you can choose the file path or directly embed the link of the flash file to add in the report. It supports .swf file types in the flash file so you can add dynamic dashboards in the report.
Crystal Reports - Charts
In this chapter, we will learn about types of charts, creating and formatting charts.
Chart Types
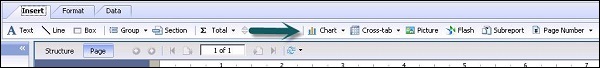
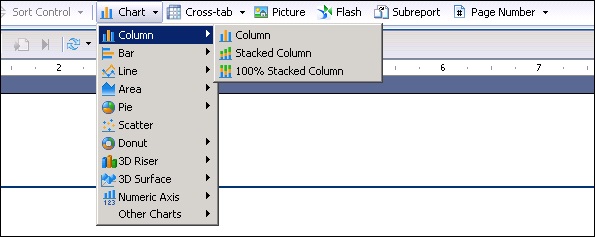
You can use below chart types in Crystal Reports for enterprise. To insert a chart, go to Insert → Chart → select Chart type and insert the chart in the structure or page tab.
Creating Charts & Chart Layout
You can insert a chart in Report footer. When you select the chart type from Insert chart option, you can move the cursor to the report footer area and click where you want to insert the chart.
When you insert a chart it gives you two options − Data and Show chart.
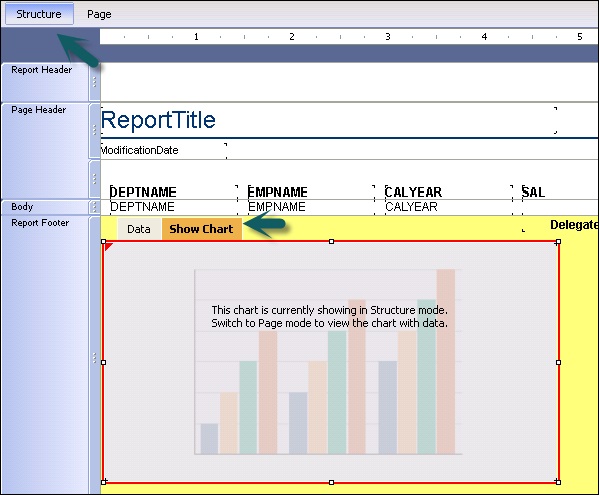
Show chart option allows you to resize the chart, move the chart in the Report footer area (as shown above).
Data tab allows you to insert the data in the chart. When you go to data tab, it asks you to add values on X, Y, Z axis.
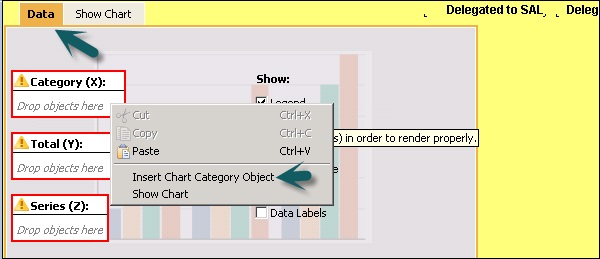
Right click on each axis and go to Insert Chart Category Object → you can choose Selected Elements from the dropdown list → Chart Data Object, Title, Subtitle, foot note, legend, etc.
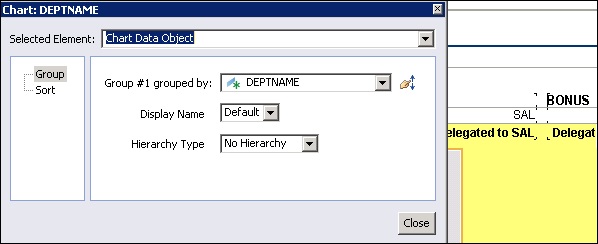
Chart Data object allows you to choose the attribute name, which you want to pass in the chart data. Title, subtitle and footnote allows you to add heading or note to the chart.
Formatting Charts
When you right click on chart it gives you the following formatting options −
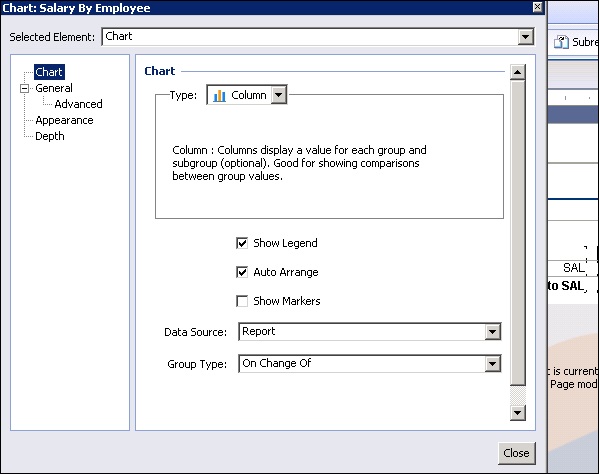
Format Chart − Allows you to format structure of the chart by going into advance, appearance and depth option. You can also change the type of chart from the dropdown list by clicking on the Chart option in the Format chart tab.
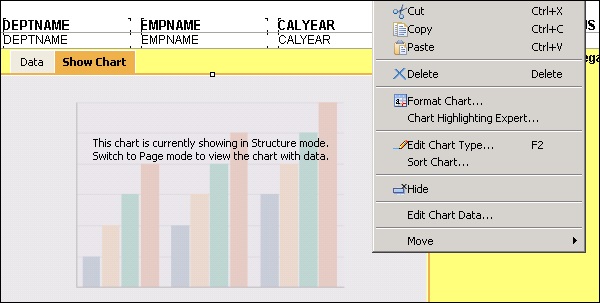
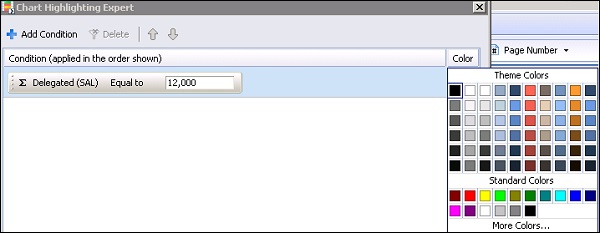
Chart Highlighting Expert allows you to highlight a specific value in the chart. You can choose different color to highlight a value inside chart.
Add Condition → Choose attribute which you want to highlight in the chart as shown in the following image.
Edit Chart Type is same as format chart with all of the options being similar.
Edit Chart data is used to edit the data in the chart. If you want to change the parameter values on the chart axis, you can click on edit chart data and change the values. Hide option is used to hide the chart and move is used to move the chart backward or forward.
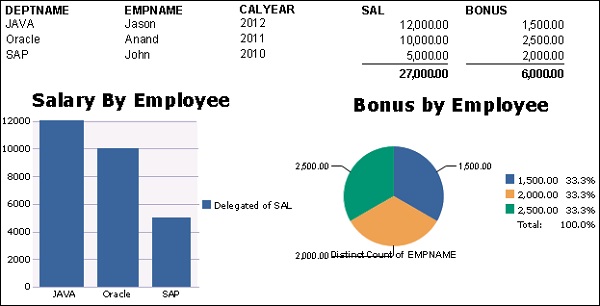
You can add multiple charts in a single report or in one row by formatting the chart size. Example - You can add bar chart and pie chart for different values to represent. You will see Show chart and Data option for the second chart → you can add required objects and also add header and footer note to the chart as shown in the following image.
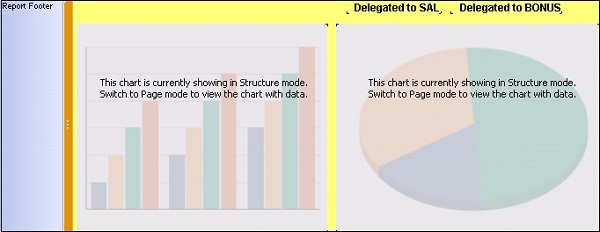
To see the actual report, go to Page tab.
Crystal Reports - Cross Tab Layout
Cross tab is used to display the data that is grouped or totaled in two directions. It shows data in a compact format, which makes it easier to understand and see the trend in the data. For example, if you want to see the quantity sold by the customer in a particular region, without cross tab, it shows the data in a spread-out form.
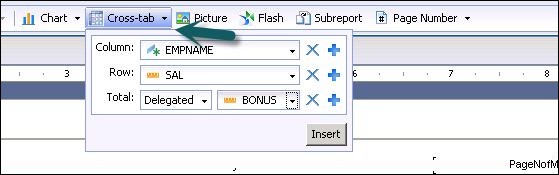
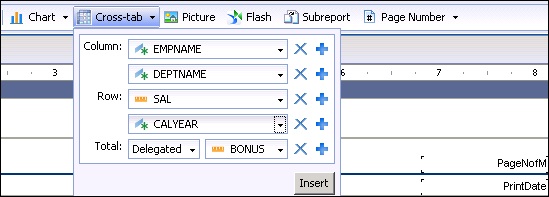
You can add multiple number of attributes in rows and columns by clicking on ‘+’ sign. To delete an object click on X sign.
When you click on Insert, cross tab adds to the Structure of the report. If you click on the page tab, it will show Cross tab data in the report.
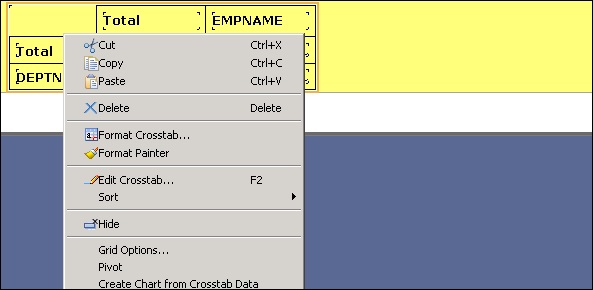
You can also edit the cells in cross tab. To edit Cross tab properties, right click on Cross tab and you can change the properties −
- Format Cross tab
- Edit Cross tab
- Sort
- Hide
- Grid Options
- Pivot
- Create chart from cross tab
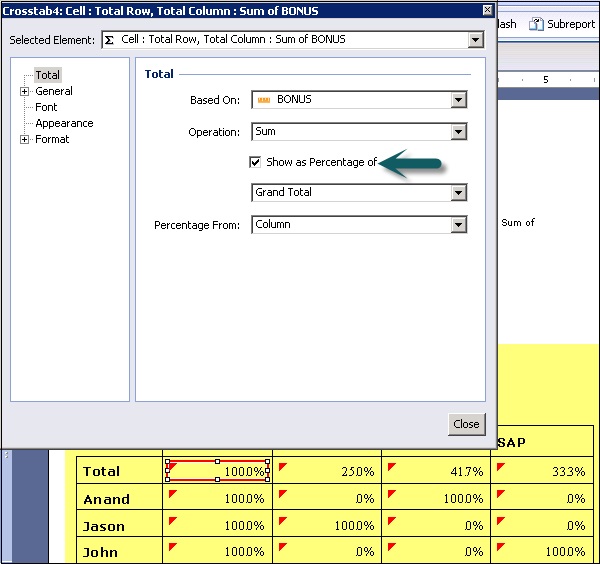
A Crosstab includes row totals, column totals and grand totals. To see values as percentage, right click on Total cell and go to Format Total → select show as percentage.
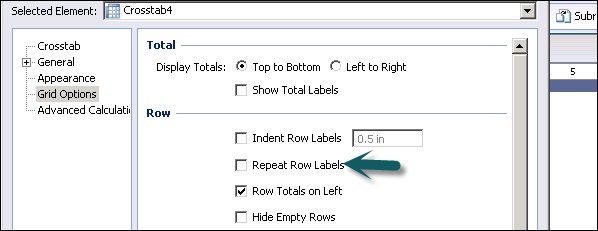
Grid options allow you to do formatting of cross tab rows like hiding empty rows, repeat row labels, hide row grand totals, etc. as shown in the following image.
Crystal Reports - Defining Formulas
Formulas are used to insert data in the report that does not exist with any of the objects. If there is a need to perform some calculations or to add specialized data in the report, you can use formulas.
Example − (Emp_details.sal)*0.15
Common formulas are − Calculations, string functions like UPPERCASE, date functions, etc.
Formula contains two parts in the report −
- Syntax
- Components
The components are used to create formulas.
Crystal Reports has the following types of formulas − Report formulas and conditional formatting formulas.
Report formulas are used as standalone in a report. Conditional formatting formulas define the condition on which report formulas are applied.
Crystal Reports - Formula Workshop
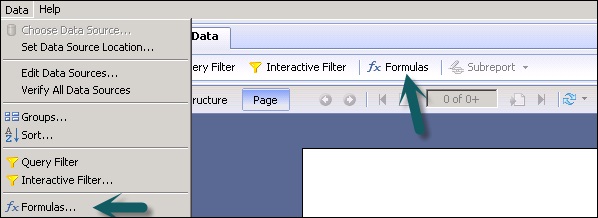
Formula workshop is used to create different kinds of formulas. You can open formula workshop by going to Data → click formulas or by clicking formula tab on Data tool bar.
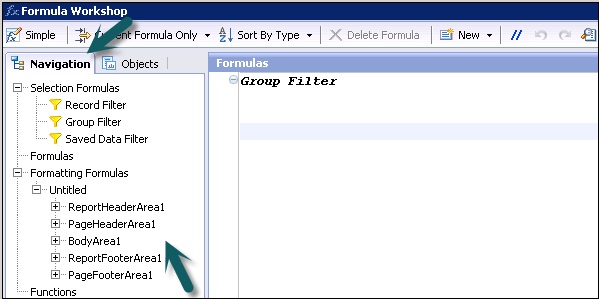
In the formula workshop there are 2 panels − Navigation Panel and Objects Panel.
Navigation panel contains a folder for each type of formulas in Crystal Reports.
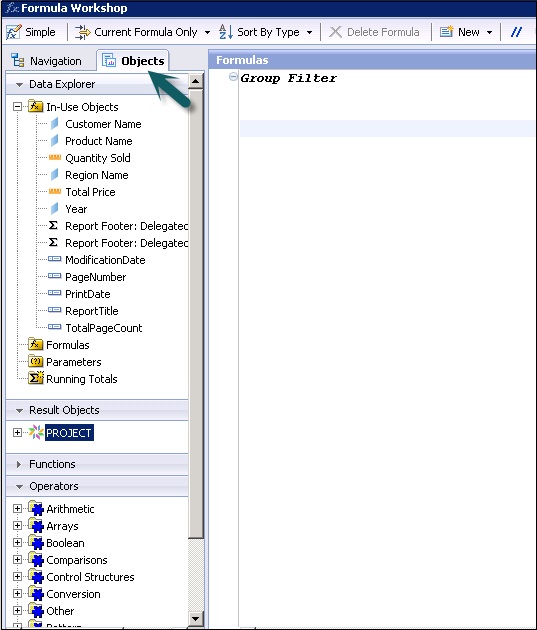
Object Panels contains 4 fields −
Data Explorer − It contains in-use Objects, formulas, parameters and running totals present in the Crystal Report.
Result Objects − It contains all result objects available to use in the report.
Functions − It contains all inbuilt functions that can be used in the report. It also includes custom functions. Example − Sum, Count, String functions, Date functions, etc.
Operators − They are used to pass conditions between values. It includes: arithmetic operators, Arrays, Boolean operators, etc.
Formula workshop also contains formula text window and formula workshop buttons. Text windows is used to create or modify formulas and workshop panel button allows you to use filter formulas, sort formulas, delete, etc.
Creating & Modifying Formulas
You can create single or multiple formulas in one go and use them in your report. You can also delete the formulas, or search and change text of formulas in the formula text window.
To create a new formula, you can right click on Formula tab under Data Explorer. Once you click on the new formula → enter the formula name → it opens the formula workshop.
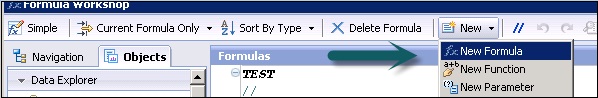
You can also create a new formula by opening the Formula workshop from the Formula tab under Data → New → New Formula as shown in the following image.
To write a formula in the formula text window, you can use in-use objects under the Operator tab and different operators to pass condition in the formula.
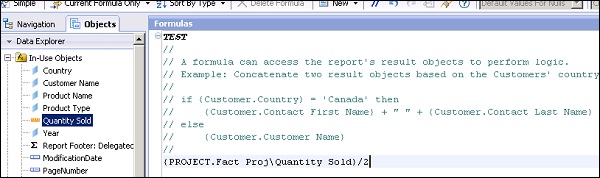
formula can be saved using the save option at the bottom of the page. Once the formula is saved it comes under the list of formulas in Data Explorer tab.
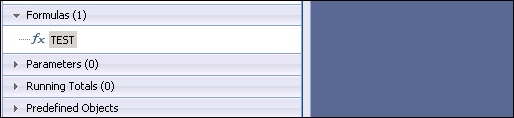
You can drag this formula to any section of the report.

In the above snapshot, Test formula has been dragged to Report footer and it has calculated value as Quantity sold/2 in the Report footer.
Now to modify the formula,click on formula name under Data explorer, it will open the Formula workshop. Make changes to formula and use the save button at the bottom to save the changes. These changes will be automatically applied to the Report values.
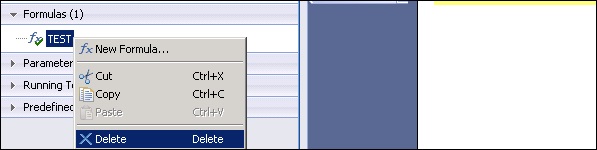
To delete the formula from a report, right click on the formula name and click on Delete.
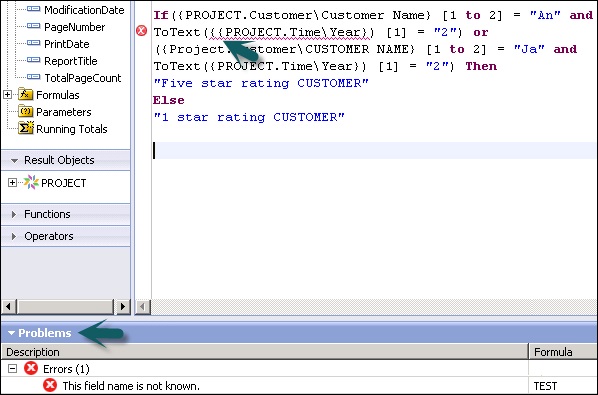
Problem pane at bottom is used for debugging purpose. It shows you the syntax error in the formula. The error message in the following image says that the field in red underline is not known as field syntax and is incorrect.
Crystal Reports - Apply Boolean Formulas
There are different Boolean operators that can be used in formula in Crystal Reports. They are −
- AND
- OR
- NOT
- Eqv
- Imp
- XOR
All these operators are used to pass multiple conditions in formulas −
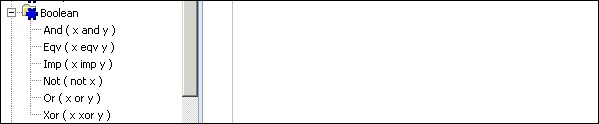
AND operator is used when you want both the conditions in the formula to be true. Other Boolean operators and their meaning is as mentioned in the above snapshot.
Using Boolean Operators ‘AND’ −
If {CUSTOMER.CUSTOMER_NAME} [1 to 2] = "AN" and
ToText({CUSTOMER.CUSTOMER ID}) [2] = "4" then
"TRUE"
Else
"FALSE"
Using Boolean Operators ‘AND’ and ‘OR’ −
If ({CUSTOMER.CUSTOMER_NAME} [1 to 2] = "AN" and
ToText({CUSTOMER.CUSTOMER ID}) [1] = "4") or
({CUSTOMER.CUSTOMER_NAME} [1 to 2] = "Ja" and
ToText({CUSTOMER.CUSTOMER ID}) [1] = "2") then
"Five star rating CUSTOMER"
Else
"1 star rating CUSTOMER"
Crystal Reports - If Then Else
The if-then-Else statement is the most basic of all the control flow statements. It tells your program to execute a certain section of code only if a particular condition meets true.
If you see the following If-Then-Else statement with Boolean operators, it has allowed you to pass multiple conditions in the formula and returning the value, if the condition is true.
If({PROJECT.Customer\Customer Name} [1 to 2] = "An" and
ToText({PROJECT.Time\Year}) [1] = "2") or
({Project.Customer\CUSTOMER NAME} [1 to 2] = "Ja" and
ToText({PROJECT.Time\Year}) [1] = "2") Then
"Five star rating CUSTOMER"
Else
"1 star rating CUSTOMER"
This statement says that when any of the condition is true (before and after OR operator), then it will print Five star rating customer otherwise it will print 1 star rating customer.
This formula has been saved and then added to the body of the report under the structure tab as shown in the following images −
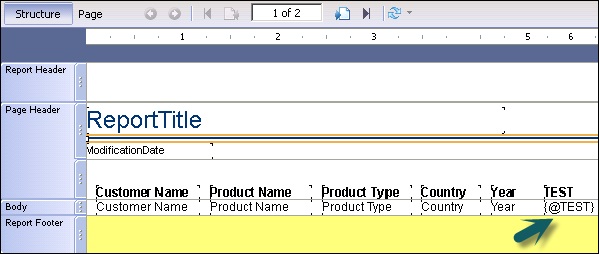
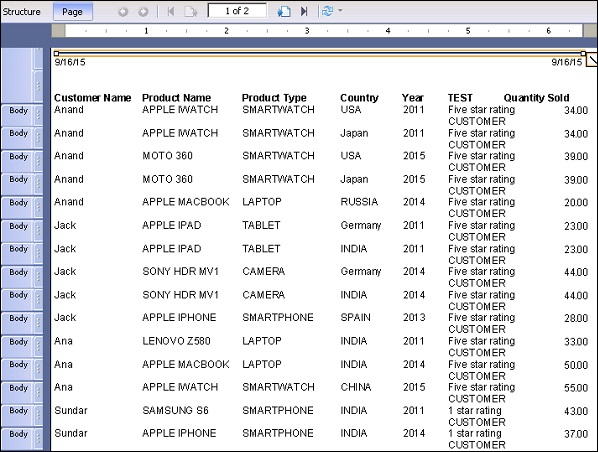
A new column in the report has been added with the rating of the customers as mentioned in the TEST formula.
Crystal Reports - Applying Calculations
Calculated formulas are used to perform mathematical calculations in Crystal Reports and they can be designed in the formula workshop.
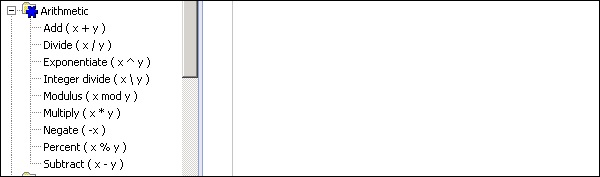
Arithmetic operators are used to design calculation formulas in workshop. There are different Arithmetic operators that can be used to Add, Divide, Exponential, Multiply, etc.
To apply a calculation in the formula, drag the object from the objects pane to the formula text pane and use operators to perform the required calculation. Once you have saved the formula using the save option at the bottom, this formula will be saved under the Formula tab in Data explorer.
You can then drag the formula to Report structure and go to Page tab to see the calculated data in the report.
List of Arithmetic operators from highest to lowest precedence are −
- Exponentiation
- Negation
- Multiply, Divide and percentage
- Integer division
- Mod
- Addition and Subtraction
Crystal Reports - Conditional Formatting
To write a conditional formatting formula, right-click the report and click Format Result Object element → select the property on which you want to apply conditional formula → click and it will open formula workshop.
Write the formula in the formula text pane, save and close it.
In this example, if you can print Total Price greater than 60000 in Green and below 60000 in Red, this can be passed in formula workshop.
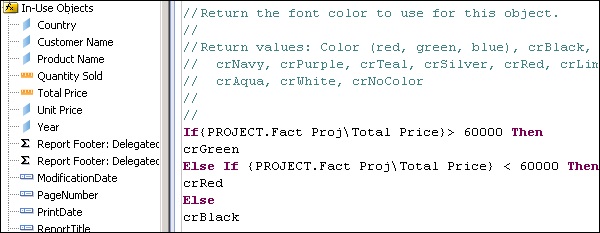
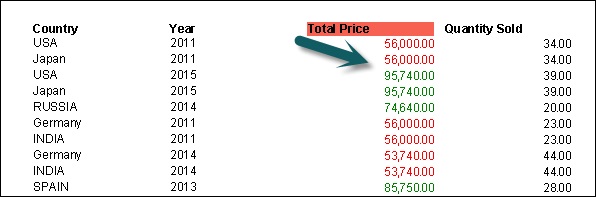
In this example, crGreen, crRed, crBlack is used. You can also use actual numeric value of color constants.
There are three common conditional formatting functions −
- CurrentObjectValue
- DefaultAttribute
- GridRowColumnValue
DefaultAttribute can be used for any formatting formula, CurrentObjectValue for any formatting formula where you are formatting an object value, and GridRowColumnValue can be used for any formatting formula where you are formatting an object value in a Cross-Tab.
Crystal Reports - Creating Variables
A Variable is used to assign different values to an object unlike constant which is fixed. When you assign a value to a variable, it maintains that value till you assign a new value to it. Before using variables, it is necessary to define them in a report.
When you declare a variable in Crystal Report you need to assign a name to it, however this name shouldn’t be the same as any other function, operator, etc. A variable can be a number type, string type, date type, Boolean type, range type or an array type. A variable can hold a value of single type, like if you declare it as a number it can’t be used to hold string values later.
Defining a Variable
Local Stringvar Customer_Lastname
Local numbervar Sales_percentage
The keyword for declaring the variable has ‘var’ at the end and it is true for all variable types. You can also assign an initial value to a variable with declaration or in separate syntax.
Local NumberVar Z; //Declare Z to be a Number variable
Z := 30;           //Assign the value of 30 to Z
To use Variables in formulas, its scope is defined. Variable scope can be of three types −
- Local
- Global
- Shared
This defines that a variable in one formula can be used in other formula.
Local Variables
Local variables are declared using the local keyword followed by the type and followed by the variable name as in the above examples.
Local variables are restricted to a single formula. This means that you cannot access the value of a local variable in one formula from a different formula.
//Formula 1
Local NumberVar Z;
Z := 30;

//Formula 2
EvaluateAfter ({@Formula A})
Local NumberVar Z;
Z := z + 5;
In the above example, Formula 2 will return a value 5 as Z is declared as local number variable in formula 1 so it will take default value for variable Z in formula 2.
Global Variables
Global variables are used throughout the main report. Their value is available to all formulas that declare the variable, except for those in sub reports.
Global StringVar Z;
It is recommended that you use global variable only when local variables do not suffice.
Since global variables share their values throughout the main report, you cannot declare a global variable in one formula with one type and then declare a global variable with the same name in a different formula with a different type.
Shared Variables
Shared variables are used throughout the main report and all of its sub reports. Shared variables are even more general than global variables.
To use a shared variable, declare it in a formula in the main report −
Shared NumberVar Z := 10;
To use shared variables, it must be declared and assigned a value before it can be used in the main report and subreports.
Crystal Reports - Creating Arrays
An Array variable in Crystal Report can be defined by using a keyword “Array”.
Global NumberVar Array Z := [1, 2, 3];
You can also assign values to the elements of Array and these values can be used for computations in formulas. For example −
StringVar Array Z := [“Hello”,”World”];
Z[2] :=[“Bye”];
UpperCase (Z [2] )
This formula will return the string “Bye”.
You can also resize Array using Redim and Redim Preserve keywords. Redim is used to remove previous entries of an Array while resizing it, and Redim Preserve is used to contain previous Array values. For example −
Local NumberVar Array Z;
Redim Z [2]; //Now Z is [0, 0]
Z [2] := 10; //Now Z is [0, 10]
Redim Z [3]; //Now Z is [0, 0, 0], Redim has erased previous Array values.
Z [3] := 20; //Now Z is [0, 0, 20]
Redim Preserve Z [4];
//Now Z is [0, 0, 20, 0], Redim Preserve has contained previous Array values.
"finished"
Array with Loops
Arrays are also used with Loops: like For loop.
Local NumberVar Array Z;
Redim Z[10];
Local NumberVar x;
For x := 1 To 10 Do
(Z[x] := 10 * x);
Z [5] //The formula returns the Number 50
Crystal Reports - Parameters
Parameters are used to take user inputs before the report is generated. User has to answer the prompt before the report is generated and the report output depends on the response of the user for the parameter value.
By using parameters with formulas and in the report, you can create a single report that changes according to the requirement of different users.
LOVs can be used to enter prompt values in parameters. LOVs can be either static or dynamic. They can also be used as single level dynamic prompts or multilevel prompts.
Note − Parameters in Crystal Reports can be used in filters after it is retrieved from the database.
Cascading Parameters
Parameters with dependency are grouped together and are known as cascading parameters. Cascading parameters allow you to group two or more parameters in a single group.
Inherited Parameters
Parameters can also be created at universe level or in query panel and they can be later inherited into Crystal Reports. They are called inherited parameters. These parameters can be dropped at the report level but they can’t be edited in a report. These parameters can only be edited where they are created.
Parameter Data Types
Parameters in Crystal Report support below data types −
- Number
- String
- Date
- Time
- DateTime
- Currency
- Boolean
- Member
Important points to remember while using Parameters −
To use parameter in a formula, it is not necessary to be placed in the report. Parameters can be used in a formula like other objects and can be created in the Formula workshop.
Parameters can be used with static or dynamic LOVs.
You can also create a list of values from which the user can choose the parameter value instead of entering it manually.
List of Values Types
| Type | Description | When to Use |
|---|---|---|
| Static LOVs | Provides a simple list based on the values you add or import in the report |
|
| Dynamic LOVs based on report data | Provides a dynamic list from the data Source |
|
| Universe LOVs | Provides a list created and Maintained in the Universe. |
|
How to create a Parameter?
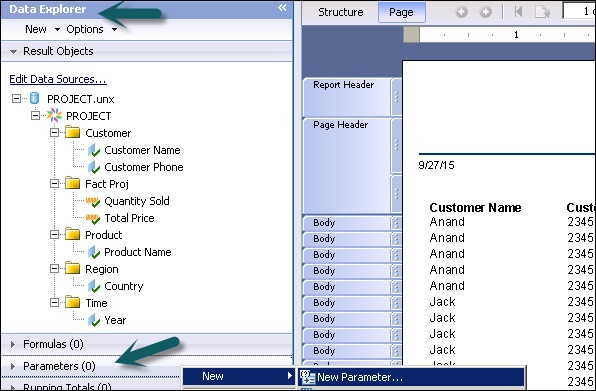
In Data Explorer view, right-click within the Parameters area → select New → New Parameter
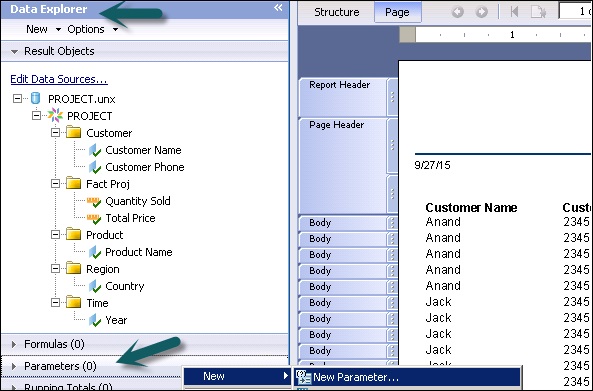
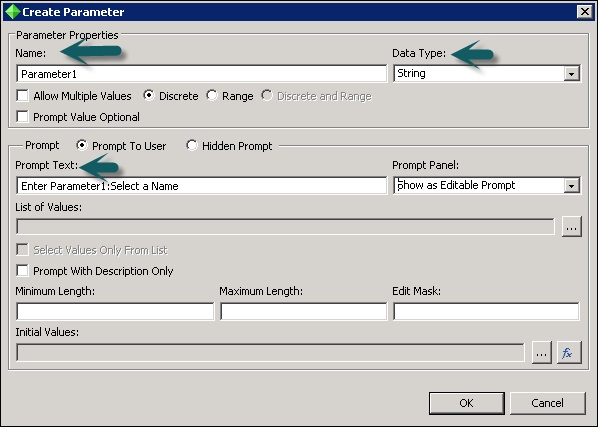
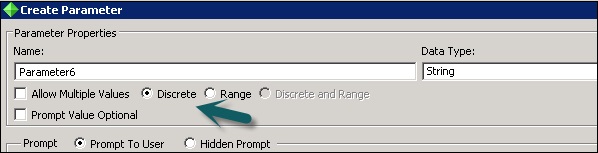
The Create Parameter dialog box appears → Enter a name for the parameter (up to 255 alphanumeric characters). In the dialog box, you can change the name and type of the parameter along with other properties.
Select the appropriate Data Type from the list → such as String, Number, or Date, among others.
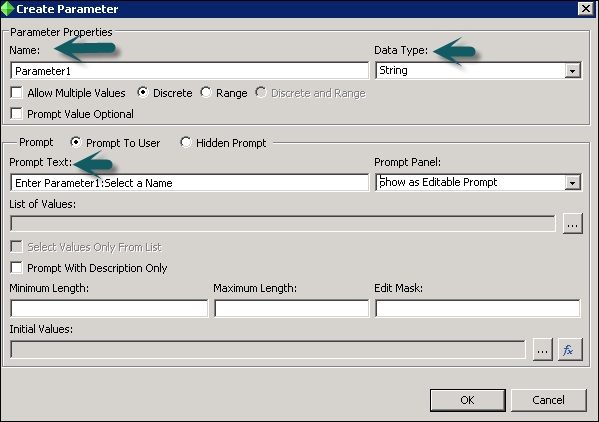
In the Prompt Text box, enter the desired prompting text (up to 255 alphanumeric characters).
For example − "Select a Name"
This text will appear in the prompting dialog box when you preview the report, or when you refresh the data on the Page area.
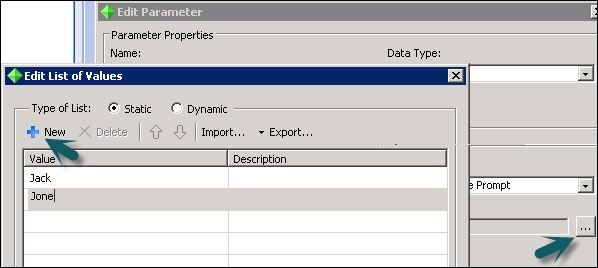
To create a list of values, click the ellipsis button → The Edit List of Values dialog box appears → Enter the values that you want to see when you are prompted → you might add a list of countries for a String type, or a list of values for a Number type → click OK → You return to the Create Parameter dialog → click OK and drag the parameter to your Report.
Once the parameter is dragged to the structure of report, you can go to page tab to see LOVs selected while refreshing the report data.
Crystal Reports - Filters
Filters are used to limit the records in a Crystal Report as per the user’s requirement. Filters are applied based on the object, operator and parameter.
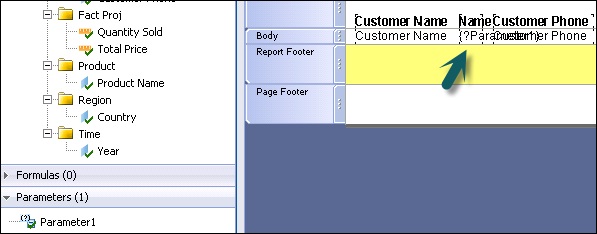
How to create an Interactive Filter in a report?
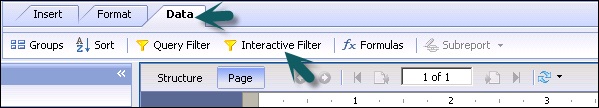
Go to Data tab at the top → Interactive Filter
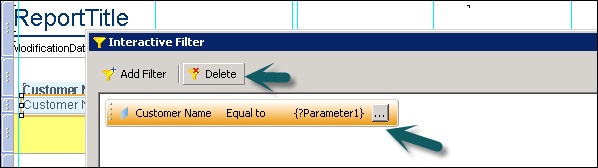
Click Add Filter → Select first object from filter → Select Operator → Select Parameter
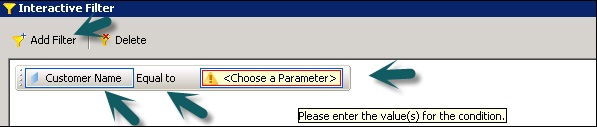
In the dropdown list it will show the list of all parameters that are created for the report. To edit the parameter, you can click on ellipsis button in the end.

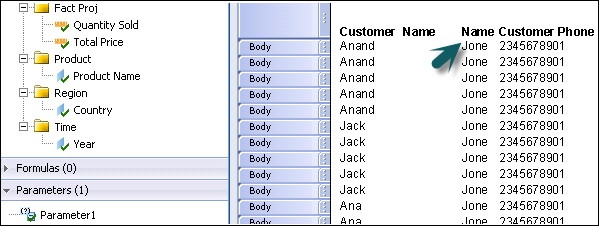
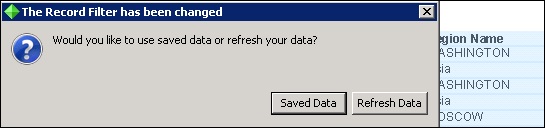
When a parameter is selected, click on OK. If you have selected list of values in parameter, it will ask you to select a value from the dropdown list → Select value → OK
Choose saved data or refresh data → Report now shows only filter data.
To add multiple interactive filters, you can use ‘AND’ and ‘OR’ operators.
To delete an interactive filter
Go to Data tab →Interactive filter → Select filter you want to delete → Click on delete button
Crystal Reports - Prompt Panels
While creating parameters, two types of prompt options can be used.
Prompt to user will create a prompt for the user to enter the value of parameter.
Hidden Prompt will be used to pass some initial values or values by formula and not by the user.
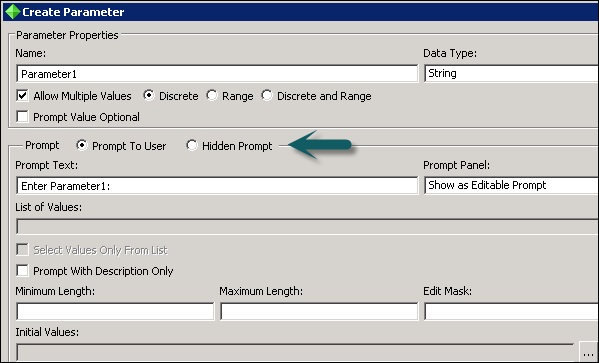
When you use prompt to user option in Prompt panel, you need to enter Prompt text. Prompt panel gives you three options −
Do not show prompt − It doesn’t give you an option to change value at the report level.
Show as Editable Prompt − It gives an option to enter different value each time.
Show as Read Only Prompt − It gives an option to see the value in read-only mode.
Hidden Prompt are used to pass initial values or values by formula.
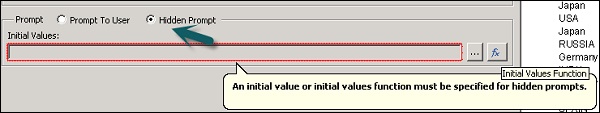
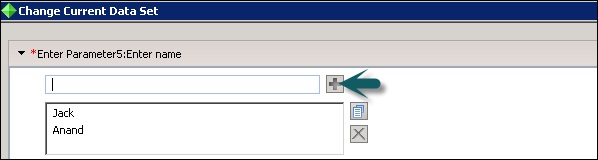
To pass initial value, click on ellipsis button just before function button. Once you click on this, it asks you to enter a value for the parameter. Once you enter the value and click on OK that value will be saved in Hidden prompt.
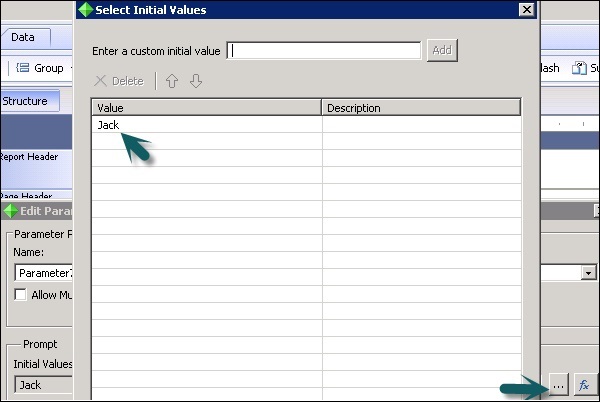
To add a value, type the value and click on Add. When you drag the parameter to the report, that value will appear in the report as shown in the above image.
Crystal Reports - Cascading Prompts
Cascading parameter group allows to arrange your parameters into groups, which provides a cascade of filtered choices.
For example, if you are prompting for a city value, but you also need to know which country and region that city comes from, you could create a cascading parameter group. In this case, you first prompt for a country, and when that value has been selected, the program prompts for a region by showing only the regions that apply to the selected country. Finally, when a region value has been selected, the program prompts for a city by showing only the cities that apply to the selected region. In this way, you can provide your user with a manageable list of cities and be sure that your user picks the correct city.
How to create a cascading parameter group?
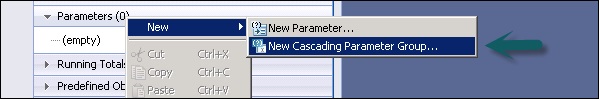
Go to Data Explorer → Parameter → New → New Cascading Parameter group
Create a Parameter Group dialog box appears → Enter a name for the Parameter group → Enter the Prompt text as shown in the following image.
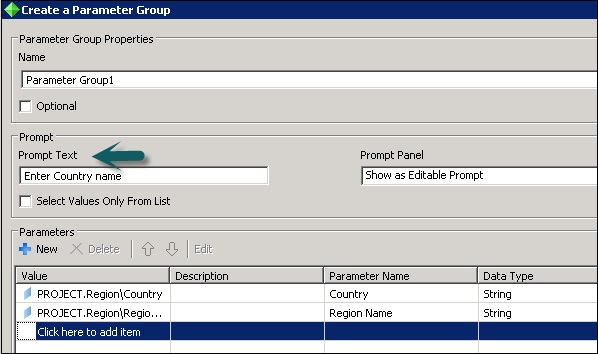
Now click the first blank row in value column, it will show you all the available objects in the list. From the list, select Country → Select blank row below Country and select Region → OK
Now drag the country parameter to the report. It will give a prompt to enter Country name. Once you choose country name → it will give a prompt to choose the region name.
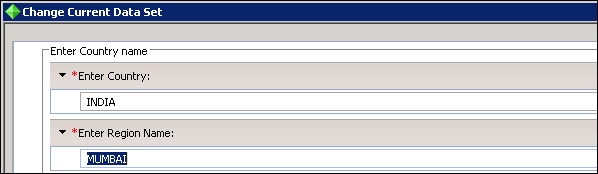
Drag Region name to the report.
Crystal Reports - Create Parameter Field
In Data Explorer view, right-click within the Parameters area → select New → New Parameter
The Create Parameter dialog box appears → Enter a name for the parameter (up to 255 alphanumeric characters). In the dialog box, you can change the name and type of the parameter along with other properties.
Select the appropriate Data Type from the list → such as String, Number, or Date, among others.
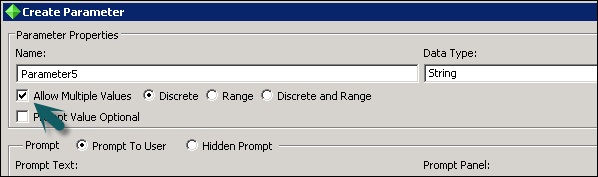
To create a parameter that allows multiple values
In the Data Explorer → right click on Parameters → select New → New Parameter
In the Create Parameter dialog box, enter a name for the parameter.
Select the appropriate Data Type from the list → Enter prompting text → Set Allow Multiple Values to True.
Now, when prompting, you can specify multiple values to be entered for the parameter.
To specify discrete or range values
For the type of value range, choose Discrete or Range.
If you select Discrete, the parameter will accept discrete values (rather than ranges of values).
If you select Range, you are prompted for parameter values. You can enter a start value and an end value. For example, if you enter the values "1" and "10", the range is 1-10, and a report that uses this parameter for filtering will display all records with values between 1 and 10. This also works for string parameters. With a start value of "A" and an end value of "H", a report that uses this parameter for filtering will display all records within an alphabetical range of A-H.
If the Allow Multiple Values and the Discrete Options are selected, the parameter will accept multiple discrete values. You can enter more than one value, but these values will be evaluated individually and will not be interpreted as a range. If the Allow Multiple Values and Range Options are selected, the parameter will accept multiple ranges.
Crystal Reports - Edit Parameter Field
Once you drag the parameter to your report → To edit parameter filed, right click on parameter name and go to edit parameter.
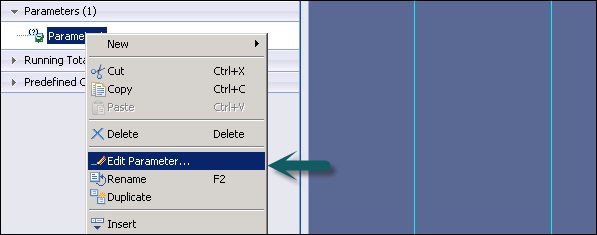
Once you click on edit parameter, it will open Edit parameter window.
You can also edit the parameter by double clicking on the parameter name.
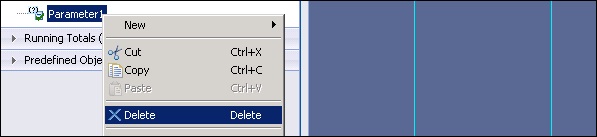
Delete Parameter Field
Go to Data Explorer view → expand Parameters, and then right click on the parameter you want to delete.
Choose Delete.
Dynamic Parameters
You can create parameters using dynamic LOVs to retrieve data from data source. For example − When the customer name in database changes frequently, you can create dynamic LOVs.
How to create a Parameter using dynamic LOVs?
Open your report → Data Explorer panel → right click within Parameters and select New Parameter.
The Create Parameter dialog box appears.
Enter a name for the parameter (up to 255 alphanumeric characters) → To create a list of values, click the “Edit List of Values” button.
The Edit List of Values dialog box appears → In the Type of List area, select Dynamic.
In the Value combo box, select Customer Name from the list.
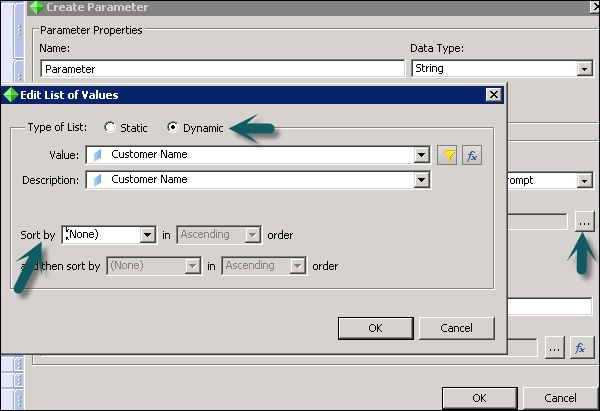
You can sort the LOV in Ascending or Descending order → Click OK.
In the Prompt Text object, enter the desired prompting text (up to 255 alphanumeric characters) → Text that appears in the prompting dialog and interactive panel. The default is “Enter (ParameterName)” → Click OK
Drag the Parameter into your report.
Crystal Subreports - Overview
Subreports allow you to combine unrelated reports into a single report. It is a report within a report. You can combine data that cannot be linked and present different views of the same data in a single report.
Difference between Subreport and main report −
It is used as an element in the main report and cannot be used as single report.
A Subreport cannot contain other subreports.
It can be placed in any report section and the entire subreport will print in that section.
It doesn’t have page header or page footers sections.
Unlinked Subreports
Unlinked subreports are standalone reports and their data is not linked to data in the main report. An unlinked subreport does not have to use the same data as the main report; it can use the same data source or a different data source entirely. Regardless of the underlying data sources, the reports are treated as unrelated.
Linked Subreports
Linked subreports use data that is coordinated with data in the main report. The program matches up the data in the subreport with data in the main report. If you create a main report with customer information and a subreport with order information and then link them, the program creates a subreport for each customer that includes all their orders.
Subreports can be linked with data-passing links or with subreport filters.
Inserting Subreports
You can insert a new report or an existing report as subreport in a main report. The subreport has similar characteristics as the main report. The data source to be used in subreport must be similar to data source that is used in main report and it must also be located on the same BI repository. You can also choose a different source connection but it should have a field to link to main report.
A subreport can’t be inserted into another subreport. A subreport can be placed in any report section and the entire subreport will print in that section. However, a subreport cannot stand on its own. It is always inserted as an element into a main report.
Formatting Subreports
How to Insert a Subreport to a main report?
Go to Insert tab, click Subreport → The program displays an element frame.
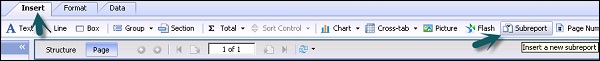
Move the cursor to where you want it to appear in the report, and click to place it.
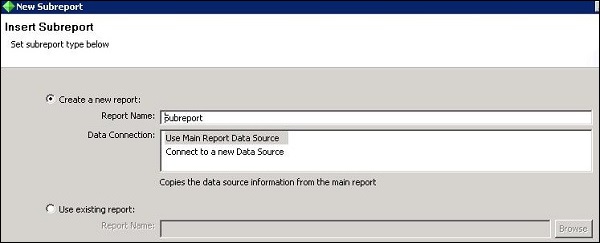
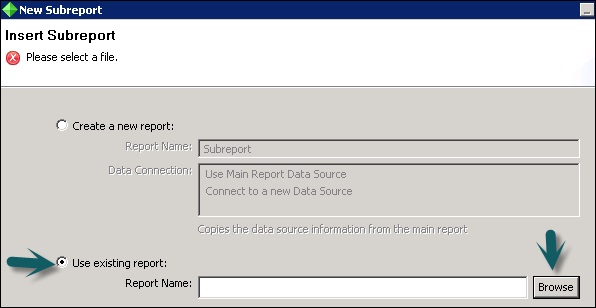
The Insert Subreport dialog box appears → Select create a new report → Type a name for the report in the Report Name text box. (You can also insert an existing subreport).
| Option | Description |
|---|---|
| Use Main Report Data Source |
|
| Connect to a new Data Source |
|
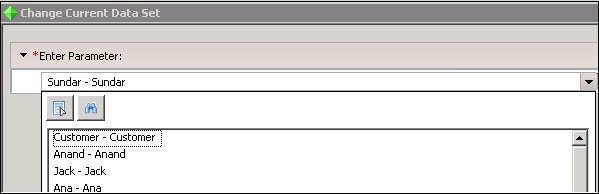
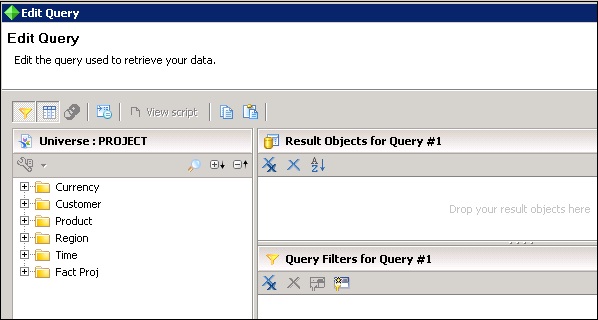
Choose an option from the Data Connection area, and click ‘Next’. If you choose Use Main Report Data Source it will open Query panel to add objects in the report.
If you select connect to a new Data source, it will open New Data source connection window from which you can choose a new data source.
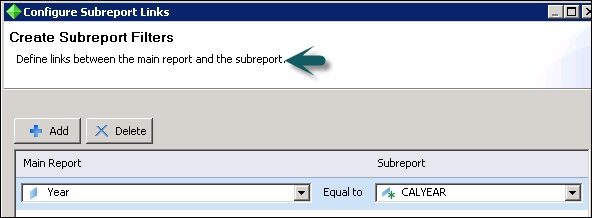
Once you choose new data source, you need to define the relationship between the main report and the subreport.
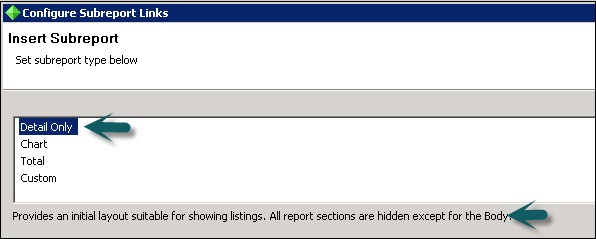
Once you click on ‘Next’ it will prompt you to choose a Sub Report type like Detailed, Chart, Total, Custom.
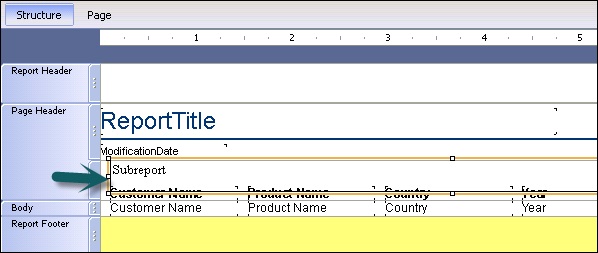
Click on finish → it will show in the Structure of the main report. If you click on Page tab it will show the data of Subreport in the main report.
To insert an existing report as a subreport
On the Insert tab, click Subreport → The program displays an element frame.
Move the cursor to where you want it to appear in the report, and click to place it.
The Insert Subreport wizard appears → Select Use existing report, and then click Browse.
The Open dialog box appears → Select the report that you would like to use, and then click Open → Click Next.
If the report you selected contains parameters, the Data Passing Links page appears.
Set up the appropriate links, and click ‘Next’. The Create Subreport Filters page appears → Create links between your main report and subreport by clicking Add → Click Finish.
The report that you selected is added as a subreport.
To save a subreport as a main report
You can also save a subreport as a main report.
Right click on the subreport frame, and click Save Subreport As → Save As
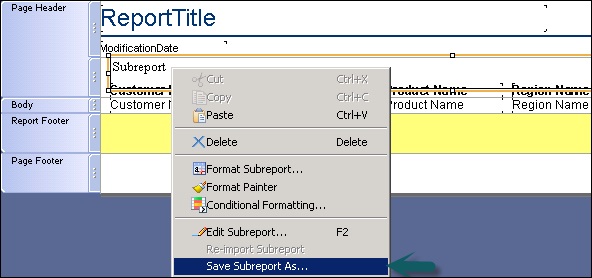
Type a new name for the subreport → Click Save.
The subreport is saved as a main report and you can open it and use it.
Edit the properties of a subreport
You can edit the properties of a subreport after you have inserted it into your main report. To format subreports −
Right click on the subreport frame and click Format Subreport.
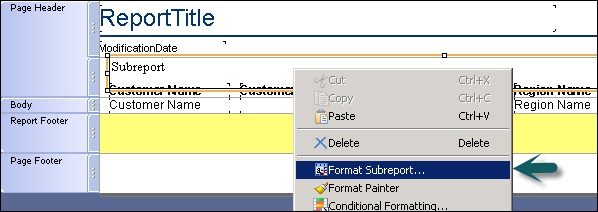
The Format dialog box appears → Edit the values.
For example, you can change the name of the subreport, edit the font, size, color, etc.
Click Close.
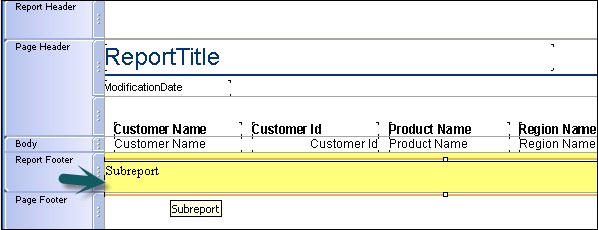
To combine two unrelated reports
Create the report you want to be printed first as the main report.
Create a new subreport.
Place the subreport into the Report Footer and it will print immediately after the main report.
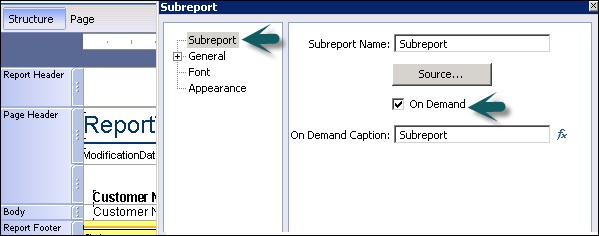
Creating an on-demand subreport
On-demand subreports can be especially useful when you want to create a report that contains multiple subreports.
The difference between regular subreports and on-demand subreports is that the actual data of an on-demand subreport is not read from the data source until the user isolates it. This way only data for on-demand subreports that are actually viewed will be retrieved from the data source. This makes the subreports much more manageable.
To create an on-demand subreport: Place an ordinary subreport in your main report. Right click on the subreport, and click Format Subreport. Click the Subreport option, and select On Demand.
Crystal Reports - Data Export Overview
Finished Crystal Reports can be exported to a number of formats like XML, HTM, PDF, spreadsheets and word processors and other common data interchange formats. This allows Crystal Report to use and distribute in an easy way.
For example, you may want to use the report data to enhance the presentation of data in a desktop publishing package. The exporting process requires you to specify a format and a destination. The format determines the file type, and the destination determines where the file is located.
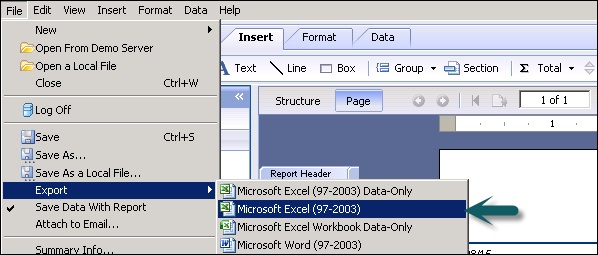
In Page mode, click File → Export and select an export format from the list.
The Export Options dialog box appears. Select the export options.
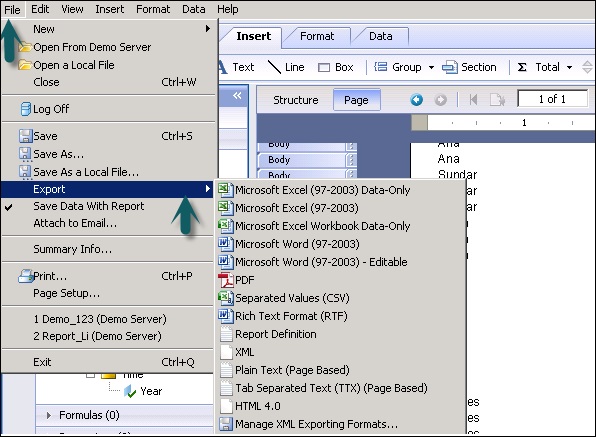
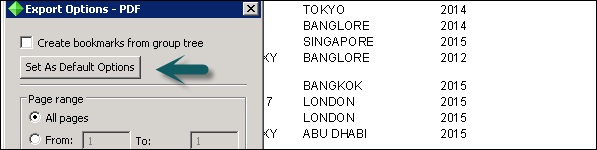
Click OK → You can also set a format as default options.
In the Export Destination dialog box that appears, do one of the following −
Click ‘To file’ and enter the report title to save the exported report in the Export Report dialog box.
Click ‘To application’ to open the report in the selected application without saving it.
Crystal Reports - Data Export To Excel
There are different Excel options to export the data of a Crystal Report.
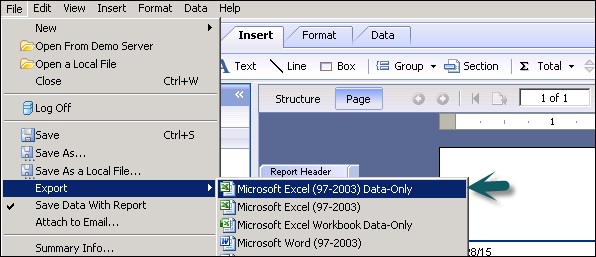
Microsoft Excel (97-2003) Data-Only
Microsoft Excel (97-2003) Data-Only is a record-based format that concentrates on the data. This format does export most of the formatting, however, it does not merge cells, and each element is added to only one cell.
This format can also export certain summaries as Excel functions. The summaries that are supported are SUM, AVERAGE, COUNT, MIN and MAX.
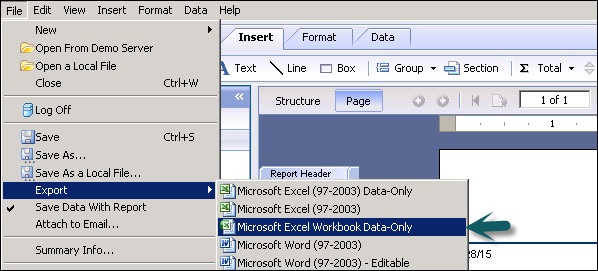
Microsoft Excel Workbook Data-Only
Microsoft Excel Workbook Data-Only is a record based format that concentrates on data as well. This exporting format is an enhancement on the existing Microsoft Excel Workbook Data-Only exporting type.
The exported result of this format is an XLSX file. XSLX file format is introduced and supported by Microsoft Excel 2007 and later. Microsoft Excel Workbook Data-Only format removes limitations of previous XLS file formats, approximately 65536 rows and 256 columns.
Microsoft Excel (97-2003)
Microsoft Excel (97-2003) Page-based format converts your report contents into Excel cells on a page-by-page basis. Contents from multiple pages are exported to the same Excel worksheet.
If a worksheet becomes full and there is more data to export, the export program creates multiple worksheets to accommodate the data. If a report element covers more than one cell, the export program merges cells to represent a report element.
Microsoft Excel has a limit of 256 columns in a worksheet so any report element that is added to cells beyond 256 columns is not exported. This export format retains most of the formatting, but it does not export line and box elements from your report.
Limitations
The Crystal Reports for Enterprise Java runtime engine does not support all of the elements embedded in a report. For example, OLAP Grids and Map elements are not supported.
Character Rendering
The character rendering technology differs between Crystal Reports for Enterprise and Crystal Reports 2013. This means that the size of each individual character can have slight differences (1 pixel) that add up over time and create additional rows or columns.
Crystal Reports - Data Export To XML
XML format is primarily used for exchange of data in the report. It uses Crystal XML Schema.
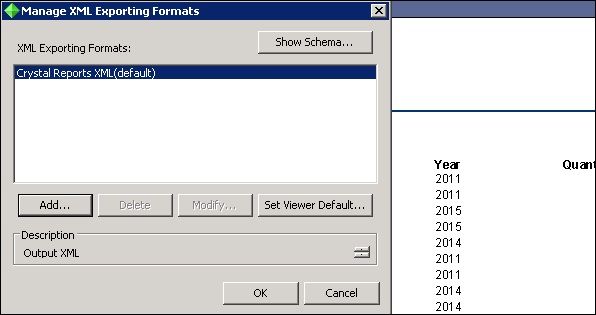
The XML expert in Crystal Reports can be used to customize XML output.
Crystal Reports - Data Export To HTML
Exporting Crystal Reports in HTML format allows an easy way to access and distribute the report data. It allows you to access your report in many of common browsers like Firefox and MS Internet Explorer.
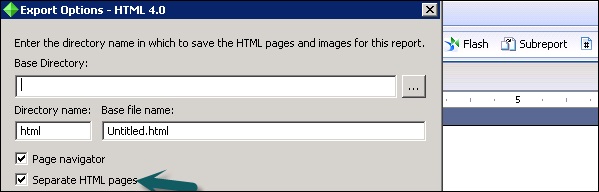
The HTML 4.0 format also saves the structure and formatting of the report by using DHTML. All of the images in your report are saved externally and a hyperlink is inserted in the exported HTML output. This export format generates more than one file in the output.
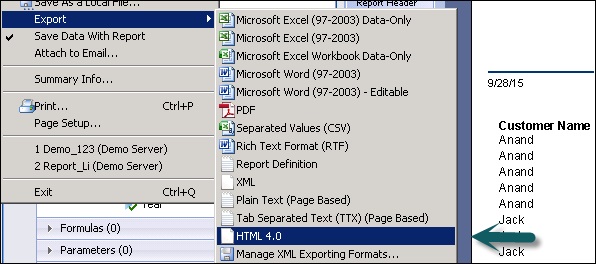
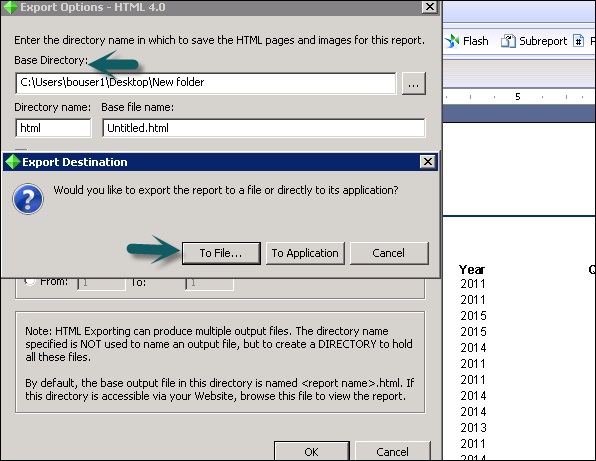
Go to File → Export and select HTML 4.0 from the list. The Export Options dialog box appears. Select a Base Directory from the Base Directory text box. Click OK.
The Export Destination dialog box opens. In the Export Destination dialog box, do one of the following −
Click ‘To File’ and enter the report title to save the exported report in the Export Report dialog box.
Click ‘To Application’ to open the report in the selected application without saving it.
If you select the option Separate HTML pages check box, the entire report is divided into separate pages. The initial HTML page will be saved as <report name>.html. This is the file you open if you want to view your report through your web browser.
Crystal Reports - Data Export To CSV
It exports the report elements as a set of values separated by separator and delimiter characters that you specify. When a comma (,) is used to separate elements, the format is known as Comma Separated Values (CSV).
This export format is popular among Microsoft Excel users. It creates one line of values for each record in your report and also contains all of the sections of your report like Page Header, Group header, Body, Group footer, Report footer and Page footer.
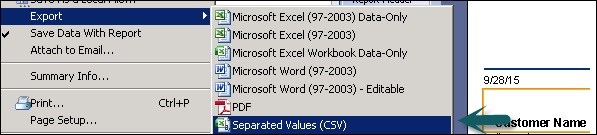
This format cannot be used to export reports with cross-tabs. It cannot be used to export reports with subreports in Page Header or Page Footer sections.
Crystal Reports - Data Export to RTF
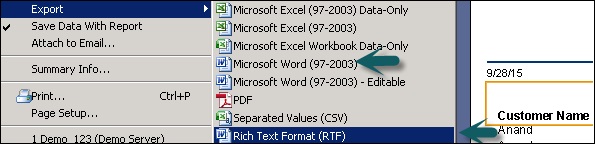
RTF format is page based format but it doesn’t preserve all structure and formatting options in the output. Microsoft Word format and Rich Text Format both produces RTF file as an output.
This format is intended for use in applications, such as fill-out forms where the space for entering text is reserved as empty text objects. Almost all of the formatting is retained in this export format.
The exporting file contains drawing objects and text fields to show objects in the report.
The Rich Text Format (RTF) and Microsoft Word (RTF) format are same.