- Crystal Reports Tutorial
- Crystal Reports - Home
- Crystal Reports - Overview
- Crystal Reports - GUI Navigation
- Crystal Reports - Options
- Crystal Reports - Page Layout
- Crystal Reports - Getting Help
- Crystal Reports - Design Environment
- Crystal Reports - Data Sources
- Crystal Reports - Queries
- Query Filters & Filter Conditions
- Crystal Reports - Time Based Filters
- Field Objects Controls & Modifications
- Crystal Reports - Sections
- Crystal Reports - Delete Sections
- Crystal Reports - Groups
- Crystal Reports - Group Options
- Crystal Reports - Templates
- Crystal Reports - Inserting Objects
- Crystal Reports - Charts
- Crystal Reports - Cross Tab Layout
- Crystal Reports - Defining Formulas
- Crystal Reports - Formula Workshop
- Creating & Modifying Formulas
- Crystal Reports - Apply Boolean Formulas
- Crystal Reports - If-Then-Else
- Crystal Reports - Applying Calculations
- Crystal Reports - Conditional Formatting
- Crystal Reports - Creating Variables
- Crystal Reports - Creating Arrays
- Crystal Reports - Parameters
- Crystal Reports - Filters
- Crystal Reports - Prompt Panels
- Crystal Reports - Cascading Prompts
- Crystal Reports - Create Parameter Field
- Crystal Reports - Edit Parameter Field
- Crystal Subreports - Overview
- Crystal Reports - Data Export Overview
- Crystal Reports - Data Export to Excel
- Crystal Reports - Data Export to XML
- Crystal Reports - Data Export to HTML
- Crystal Reports - Data Export to CSV
- Crystal Reports Useful Resources
- Crystal Reports - Quick Guide
- Crystal Reports - Useful Resources
- Crystal Reports - Discussion
Crystal Reports - Charts
In this chapter, we will learn about types of charts, creating and formatting charts.
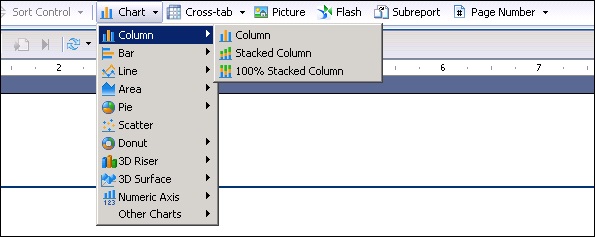
Chart Types
You can use below chart types in Crystal Reports for enterprise. To insert a chart, go to Insert → Chart → select Chart type and insert the chart in the structure or page tab.
Creating Charts & Chart Layout
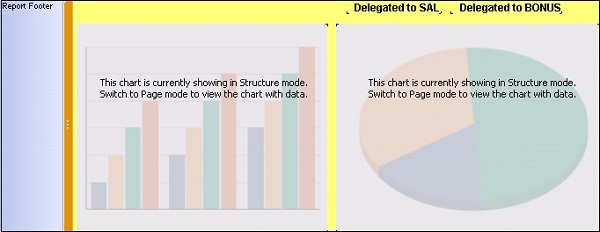
You can insert a chart in Report footer. When you select the chart type from Insert chart option, you can move the cursor to the report footer area and click where you want to insert the chart.
When you insert a chart it gives you two options − Data and Show chart.
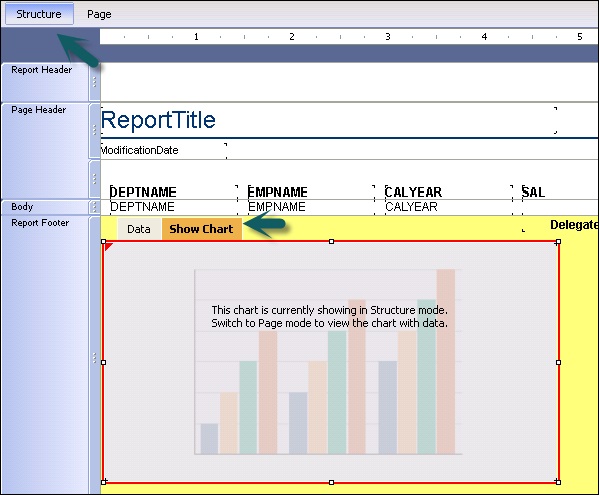
Show chart option allows you to resize the chart, move the chart in the Report footer area (as shown above).
Data tab allows you to insert the data in the chart. When you go to data tab, it asks you to add values on X, Y, Z axis.
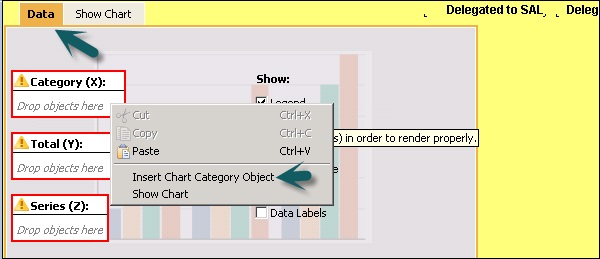
Right click on each axis and go to Insert Chart Category Object → you can choose Selected Elements from the dropdown list → Chart Data Object, Title, Subtitle, foot note, legend, etc.
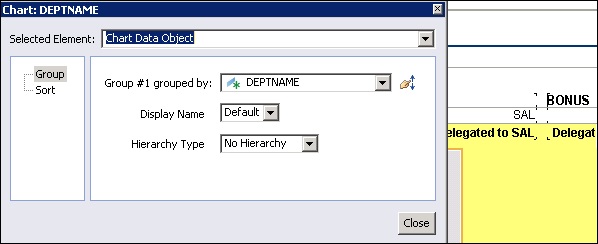
Chart Data object allows you to choose the attribute name, which you want to pass in the chart data. Title, subtitle and footnote allows you to add heading or note to the chart.
Formatting Charts
When you right click on chart it gives you the following formatting options −
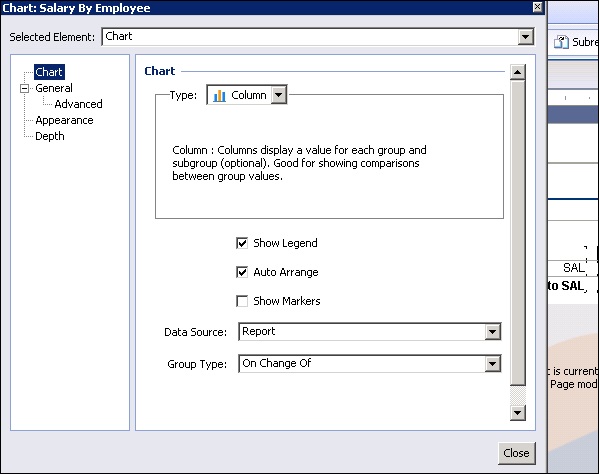
Format Chart − Allows you to format structure of the chart by going into advance, appearance and depth option. You can also change the type of chart from the dropdown list by clicking on the Chart option in the Format chart tab.
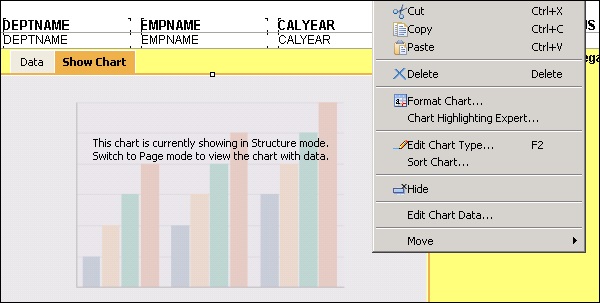
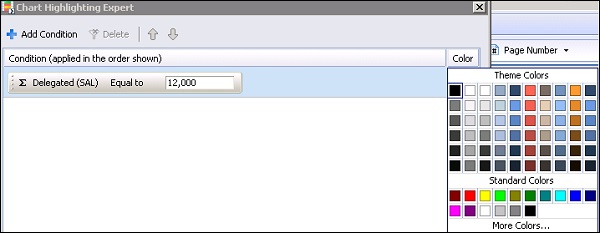
Chart Highlighting Expert allows you to highlight a specific value in the chart. You can choose different color to highlight a value inside chart.
Add Condition → Choose attribute which you want to highlight in the chart as shown in the following image.
Edit Chart Type is same as format chart with all of the options being similar.
Edit Chart data is used to edit the data in the chart. If you want to change the parameter values on the chart axis, you can click on edit chart data and change the values. Hide option is used to hide the chart and move is used to move the chart backward or forward.
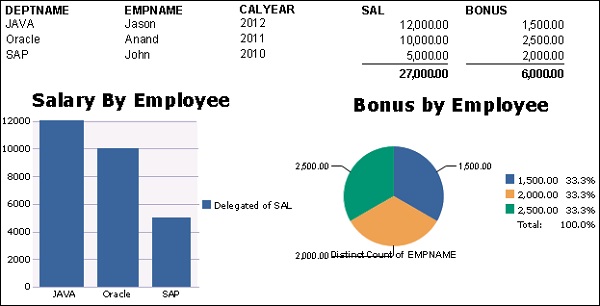
You can add multiple charts in a single report or in one row by formatting the chart size. Example - You can add bar chart and pie chart for different values to represent. You will see Show chart and Data option for the second chart → you can add required objects and also add header and footer note to the chart as shown in the following image.
To see the actual report, go to Page tab.