- Cognos Tutorial
- Cognos - Home
- Data Warehousing
- Data Warehouse - Overview
- Data Warehouse - Schemas
- ETL & Reporting Tools
- Cognos Basics
- Cognos - Introduction
- Cognos - Components and Services
- Cognos - Connections
- Cognos - Packages
- Cognos - Framework Manager
- Relationships in Metadata Model
- Query Studio
- Cognos - Query Studio
- Cognos - Ad-hoc Reports
- Cognos - Report Types
- Cognos - Creating a Report
- Cognos - Open an Existing Report
- Cognos - Add Data to a Report
- Cognos - Saving a Report
- Cognos - Run a Report
- Cognos - Printing a Report
- Report Studio
- Cognos - Report Studio
- Cognos - Report Templates
- Cognos - List Report
- Cognos - Crosstab Report
- Cognos - Creating a Chart
- Cognos - Report Functions
- Cognos - Report Validation
- Cognos - Report Run with Options
- Cognos - Report Administration
- Cognos - Filters
- Cognos - Custom Calculations
- Analysis Studio
- Cognos - Analysis Studio
- Cognos - Create an Analysis
- Cognos - Save an Analysis
- Cognos - Open Existing Analysis
- Event Studio
- Cognos - Event Studio
- Cognos - Notification Methods
- Cognos Useful Resources
- Cognos - Quick Guide
- Cognos - Useful Resources
- Cognos - Discussion
Cognos - Analysis Studio
Analysis Studio is used to focus on the items that are important for the business. You can do comparisons, trend analysis and analysis like top and bottom performers and also allow you to share your analysis with others.
Analysis Studio is not only used by BI Analysts but also by business users who understand business and want to find answers to business queries using historical data.
You can use Analysis Studio to compare and manipulate data to understand the relationships between data and its relative importance. Whether you want to assess revenue growth or to identify top performers, Analysis Studio provides the filtering, calculating, and sorting support you need for analysis.
Interface
The Analysis Studio consists of several areas that are shown in the following areas and are explain in detail as well.
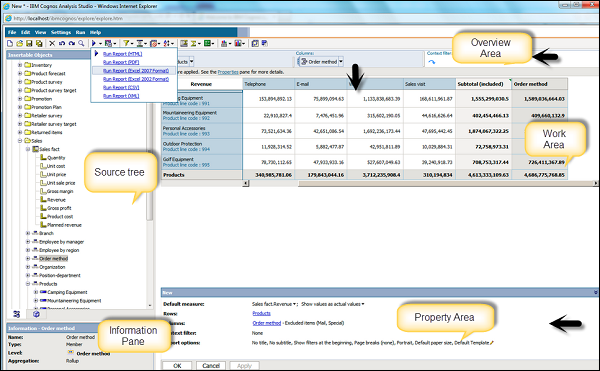
Insertable Object Pane − The Source tab of the Insertable Objects pane contains the source tree for the package selected for the analysis.
Information Pane − The Information pane shows the name, level, attributes (if any), and aggregation associated with the selected item in the source tree, as well as any additional information provided by the data modeler.
Properties Pane − You can use Properties pane to make several changes and apply them at the same time, instead of running different commands.
Work Area − This area contains the crosstab or charts to perform the analysis. You can display analysis in the form a Crosstab, chart or a combination of both.
And lastly there is the Overview Area as well.