- AWS ElastiCache Tutorial
- Home
- Overview
- Environment
- Interfaces
- Launching Cluster
- Viewing Cluster Details
- Cluster Endpoints
- Accessing Cluster
- Modifying Cluster
- Rebooting Cluster
- Adding Nodes
- Removing Nodes
- Scaling the Clusters
- Delete Cluster
- Redis Shards
- Parameter Group
- Listing Parameters
- Deleting Parameters
- Engine Parameters
- Backup and Restore
- Monitoring Node - Metrics
- Memcached & Redis
- Accessing Memcached Cluster
- Lazy Loading
- Write Through
- Add TTL
- Memcached VPC
- Creating Memcached Cluster
- Connecting to Cluster in VPC
- Delete Memcached Cluster
- IAM policies
- SNS Notifications
- Events
- Managing Tags
- Managing Costs
- AWS ElastiCache - Resources
- Quick Guide
- Useful Resources
- Discussion
AWS ElastiCache - Monitoring Node-Metrics
To monitor the usage and health of clusters, ElastiCache provides metrics which can be accessed through CloudWatch. These metrics can be host-level metrics. CPU utilization is an example of host-level metrics. There are also metrics that are specific to the cache engine software. Cache gets and cache misses are examples of engine specific metrics. These metrics are measured and published for each Cache node in 60-second intervals.
Host Level Metrics
Host level metrics measure various aspects of performance of the host machine where the ElastiCache node is located. Below is the example of few important host level metrics. Also, different metrics have different types of measurements. Like one metric is measure as a percentage while the other is measured as count value.
| Metric | Description | Unit |
|---|---|---|
| CPUUtilization | The percentage of CPU utilization for the entire host. Because Redis is single-threaded, we recommend you monitor EngineCPUUtilization metric if available. | Percent |
| FreeableMemory | The amount of free memory available on the host. This is derived from the RAM, buffers and cache that the OS reports as freeable. | Bytes |
| SwapUsage | The amount of swap used on the host. | Bytes |
| NetworkBytesIn | The number of bytes the host has read from the network. | |
| NetworkBytesOut | The number of bytes sent out on all network interfaces by the instance. | Bytes |
Engine Level Metrics
These metrics depend on the type and version of the engine deployed in ElastiCache. They measure the performance of the engine and based on their values we can decide whether to change engine or re-configure some parameters in that cache engine. Each metric is calculated at the cache node level. Below is the list of few such metrics.
| Metric | Description | Unit |
|---|---|---|
| CacheHits | The number of successful read-only key lookups in the main dictionary. This is derived from keyspace_hits statistic. | Count |
| CacheMisses | The number of unsuccessful read-only key lookups in the main dictionary. This is derived from keyspace_misses. | Count |
| CurrConnections | The number of client connections, excluding connections from read replicas. ElastiCache uses two to three of the connections to monitor the cluster in each case. This is derived from the connected_clients statistic. | Count |
| EngineCPUUtilization | EngineCPUUtilization provides access to the Redis process CPU utilization to gain better insights into your Redis workloads. As Redis is single threaded and uses just one CPU core at any given point in time, EngineCPUUtilization provides more precise visibility into the load of the Redis process itself. | Percent |
| NewConnections | The total number of connections that have been accepted by the server during this period. This is derived from the total_connections_received statistic. | Count |
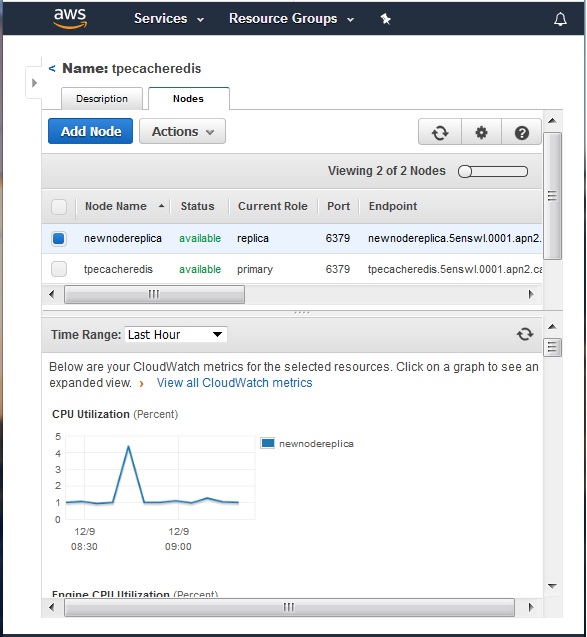
Monitoring the Metrics
We can look at the values of the metrics across different time periods. Like in past 1 hour or past 1 day etc. For this we go to the console then ElastiCache dashboard. From the dashboard select the cluster and then the name of the node whose metrics we want to monitor. Select the nodes and then select the check box beside the name of the node we want to monitor. The below diagram shows the metrics window that pops-up.
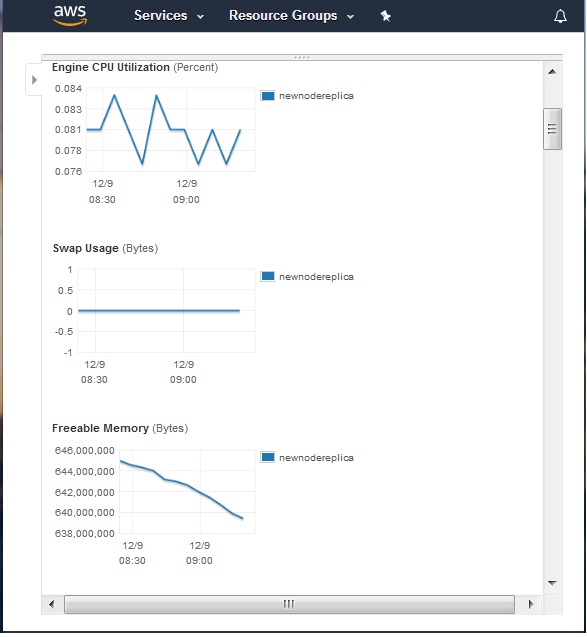
On scrolling down further we see many more metrices which are presented as a graph showing values at different time intervals.