- AWS Quicksight Tutorial
- AWS Quicksight - Home
- AWS Quicksight - Overview
- AWS Quicksight - Landing Page
- AWS Quicksight - Using Data Sources
- AWS Quicksight - Data Source Limit
- AWS Quicksight - Editing Datasets
- AWS Quicksight - Creating New Analysis
- AWS Quicksight - Adding Visuals
- Using Filters to a Visual
- AWS Quicksight - Insights
- AWS Quicksight - Creating Story
- AWS Quicksight - Using Parameters
- AWS Quicksight - Sharing Analysis
- AWS Quicksight - Dashboards
- AWS Quicksight - Managing Quicksight
- AWS Quicksight - Edition Type
- AWS Quicksight - Managing IAM Policies
- AWS Quicksight - Embedding Dashboard
- AWS Quicksight - AWS SDKs
- Developer Responsibilities
- AWS Quicksight Useful Resources
- AWS Quicksight - Quick Guide
- AWS Quicksight - Useful Resources
- AWS Quicksight - Discussion
AWS Quicksight - Quick Guide
AWS Quicksight - Overview
AWS Quicksight is one of the most powerful Business Intelligence tools which allows you to create interactive dashboards within minutes to provide business insights into the organizations. There are number of visualizations or graphical formats available in which the dashboards can be created. The dashboards get automatically updated as the data is updated or scheduled. You can also embed the dashboard created in Quicksight to your web application.
With the latest ML insights, also known as Machine Learning insights, Quicksight uses its inbuilt algorithms to find any kind of anomalies or peaks in the historical data. This helps to get prepared with the business requirements ahead of time based on these insights. Here is quick guide to get started with Quicksight.
Below is official product description page from AWS −
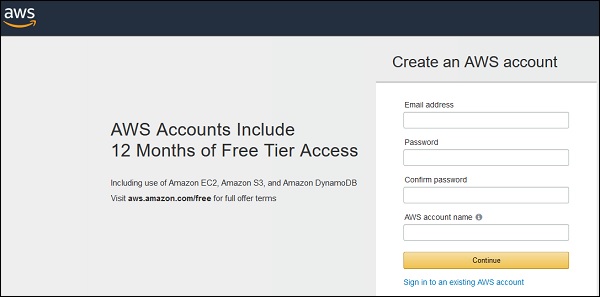
https://aws.amazon.com/quicksight/You can also subscribe for an AWS trial account by filling the below mentioned information and click on Continue button.
AWS Quicksight - Landing Page
To access AWS Quicksight tool, you can open it directly by passing this URL in web browser or navigating to AWS Console → Services
https://aws.amazon.com/quicksight/
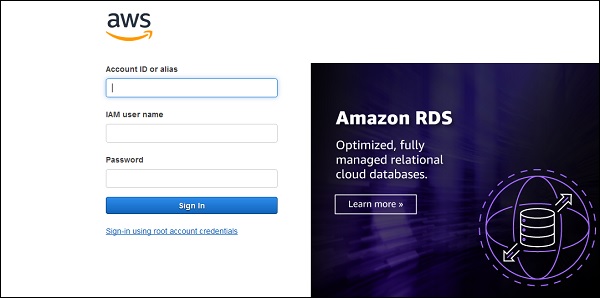
Once you open this URL, on top right corner click on “Sign in to the Console”.
You need to provide the below details to login to Quicksight tool −
- Account ID or alias
- IAM User name
- Password
Once you login into Quicksight, you will see the below screen −
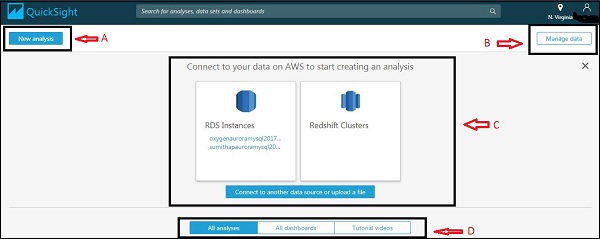
As marked in the above image,
Section A − “New Analysis” icon is used to create a new analysis. When you click on this, it will ask you to select any data set. You can also create a new data set as shown below −
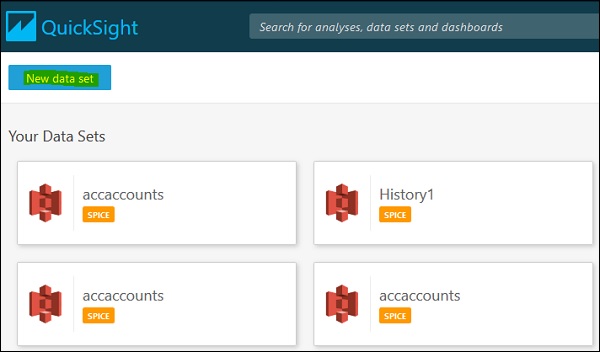
Section B − The “Manage data” icon will show all the data sets that have already been input to Quicksight. This option can be used to manage the dataset without creating any analysis.
Section C − It shows various data sources you have already connected to. You can also connect to a new data source or upload a file.
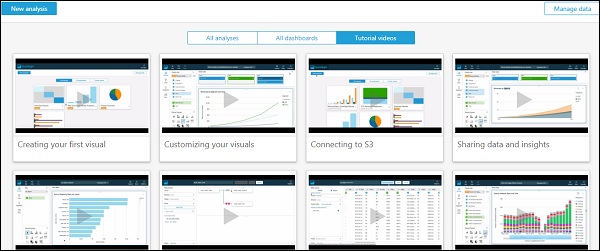
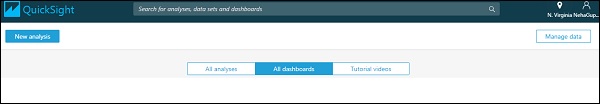
Section D − This section contains icon for already created analysis, published dashboards and tutorial videos explaining about Quicksight in detail.
You can click on each tab to view them as below −
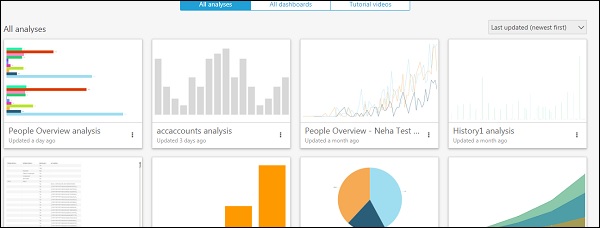
All analysis
Here, you can see all the existing analysis in AWS Quicksight account including report and dashboards.
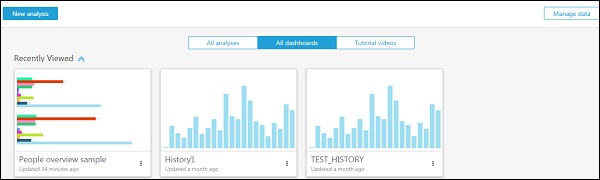
All dashboards
This option shows only existing dashboards in AWS Quicksight account.
Tutorial videos
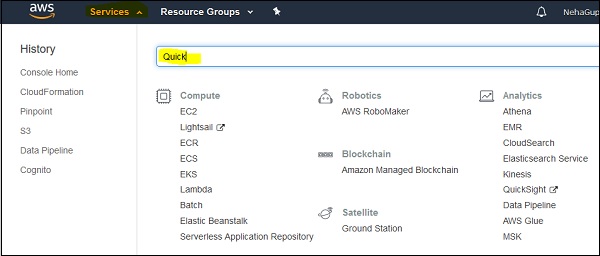
Other option to open Quicksight console is by navigating to AWS console using below URL −
https://aws.amazon.com/console/
Once you login, you need to navigate to Services tab and search for Quicksight in search bar. If you have recently used Quicksight services in AWS account, it will be seen under History tab.
AWS Quicksight - Using Data Sources
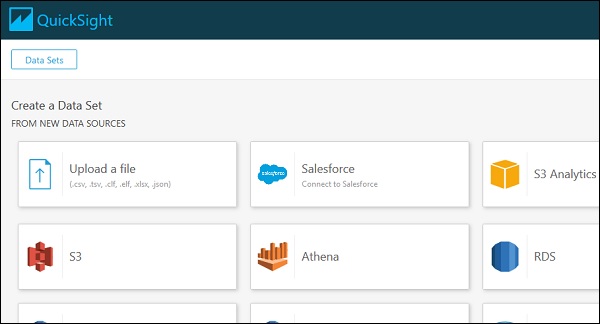
AWS Quicksight accepts data from various sources. Once you click on “New Dataset” on the home page, it gives you options of all the data sources that can be used.
Below are the sources containing the list of all internal and external sources −
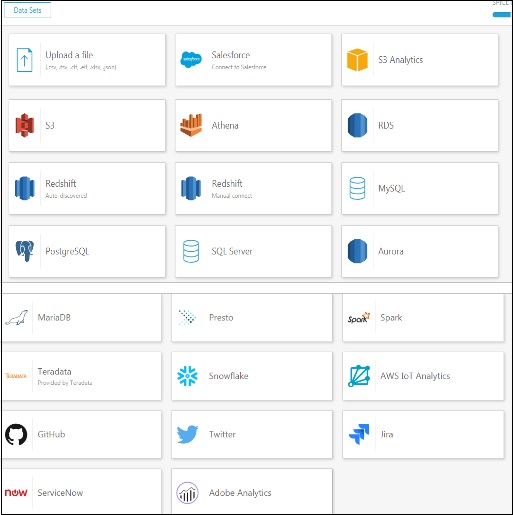
Let us go through connecting Quicksight with some of the most commonly used data sources −
Uploading a file from system
It allows you to input .csv, .tsv, .clf,.elf.xlsx and Json format files only. Once you select the file, Quicksight automatically recognizes the file and displays the data. When you click on Upload a File button, you need to provide the location of file which you want to use to create dataset.
Using a file from S3 format
The screen will appear as below. Under Data source name, you can enter the name to be displayed for the data set that would be created. Also you would require either uploading a manifest file from your local system or providing the S3 location of the manifest file.
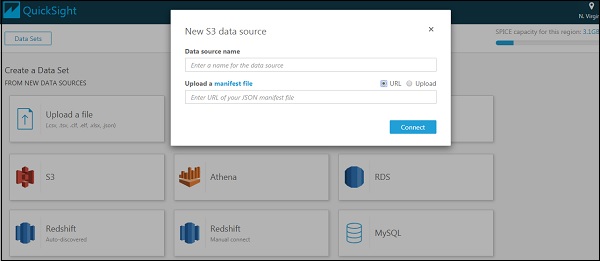
Manifest file is a json format file, which specifies the url/location of input files and their format. You can enter more than one input files, provided the format is same. Here is an example of a manifest file. The “URI” parameter used to pass the location of input file is S3.
{
   "fileLocations": [
      {
         "URIs": [
            "url of first file",
            "url of second file",
            "url of 3rd file and so on"
         ]
      },

   ],
}
"globalUploadSettings": {
   "format": "CSV",
   "delimiter": ",",
   "textqualifier": "'",
   "containsHeader": "true"
}
The parameters passed in globalUploadSettings are the default ones. You can change these parameters as per your requirements.
MySQL
You need to enter the database information in the fields to connect to your database. Once it is connected to your database, you can import the data from it.
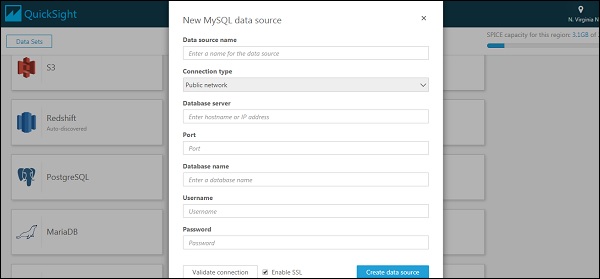
Following information is required when you connect to any RDBMS database −
- DSN name
- Type of connection
- Database server name
- Port
- Database name
- User name
- Password
Following RDBMS based data sources are supported in Quicksight −
- Amazon Athena
- Amazon Aurora
- Amazon Redshift
- Amazon Redshift Spectrum
- Amazon S3
- Amazon S3 Analytics
- Apache Spark 2.0 or later
- MariaDB 10.0 or later
- Microsoft SQL Server 2012 or later
- MySQL 5.1 or later
- PostgreSQL 9.3.1 or later
- Presto 0.167 or later
- Snowflake
- Teradata 14.0 or later
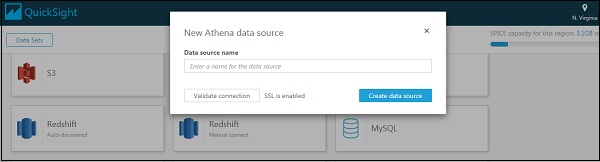
Athena
Athena is the AWS tool to run queries on tables. You can choose any table from Athena or run a custom query on those tables and use the output of those queries in Quicksight. There are couple of steps to choose data source
When you choose Athena, below screen appears. You can input any data source name which you want to give to your data source in Quicksight. Click on “Validate Connection”. Once the connection is validated, click on the “Create new source” button
Now choose the table name from the dropdown. The dropdown will show the databases present in Athena which will further show tables in that database. Else you can click on “Use custom SQL” to run query on Athena tables.
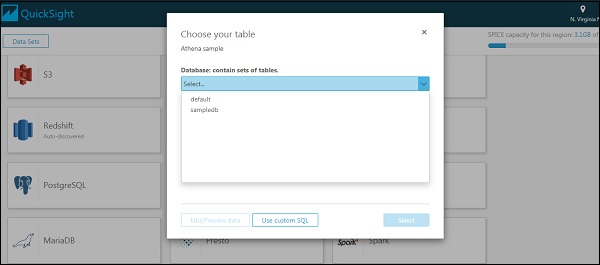
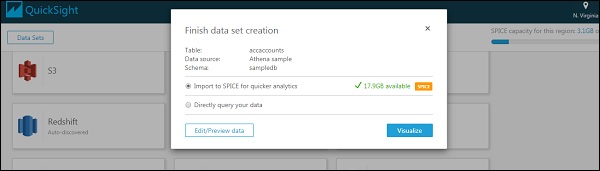
Once done, you can click on “Edit/Preview data” or “Visualize” to either edit your data or directly visualize the data as per your requirement.
Deleting a data source
When you delete a data source which is in use in any of the Quicksight dashboards, it can make associated data set unusable. It usually happens when you query a SQL based data source.
When you create a dataset based on S3, Sales force or SPICE, it does not affect your ability to use any dataset as data is stored in SPICE; however refresh option is not available in this case.
To delete a data source, select the data source. Navigate to From Existing Data Source tab on creating a dataset page.
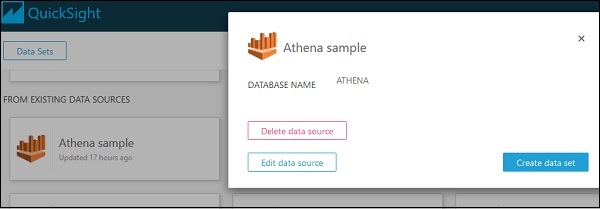
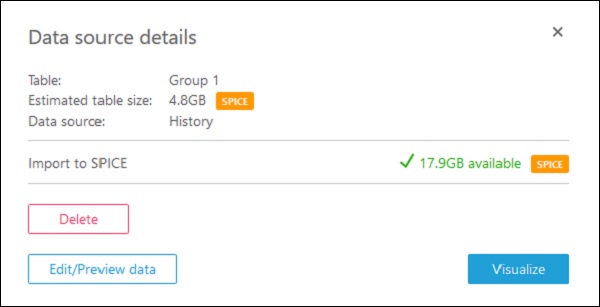
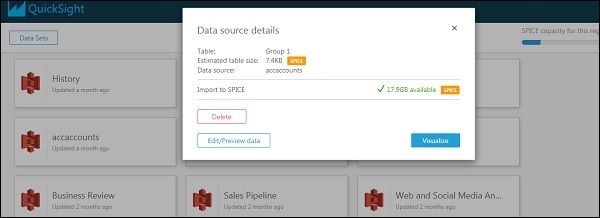
Before deletion, you can also confirm estimated table size and other details of data source.
AWS Quicksight - Data Source Limit
When you use different data sources in Quicksight tool, there are certain limits that apply based on data sources.
File
You can use up to 25GB of total size specified in manifest file. This limit is dependent on the file size after it is imported to SPICE.
The number of files supported in manifest file is 1000 and you also have some limit on number of columns in each file.
Table and Query
When you are querying a large table, it is recommended that you use Where or Having condition to reduce the number of data imported to SPICE. Query result imported into SPICE should not exceed 25 GB.
You can deselect some of the columns while importing the data into SPICE.
In case your data source contains data type which are not supported in Quicksight, AWS Quicksight skips those values.
| Person ID | Sales Date | Amount |
|---|---|---|
| 001 | 10/14/2017 | 12.43 |
| 002 | 5/3/2017 | 25.00 |
| 003 | Unknown | 18.17 |
| 004 | 3/8/2019 | 86.02 |
From the above values, Quicksight will drop the no date value row while importing this data in dataset. Following data types are supported in Quicksight −
| Database Source | Number Data Types | String Data Types | Date time Data Types | Boolean Data Types |
|---|---|---|---|---|
| Amazon Athena,Presto |
|
|
|
|
| Amazon Aurora, MariaDB,and MySQL |
|
|
|
|
| PostgreSQL |
|
|
|
|
| Apache Spark |
|
|
|
|
| Snowflake |
|
|
|
|
| Microsoft SQL Server |
|
|
|
|
AWS Quicksight - Editing Datasets
When you create a new dataset to be used in Quicksight, the following message would appear. You can preview or edit the data as per your requirement. You can change the types of certain fields, rename the headers or add some calculated fields based on input fields.
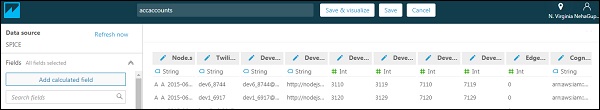
Once you click Edit/Preview data, you will be able to see the header and the fields on your input dataset. Here is a sample dataset −
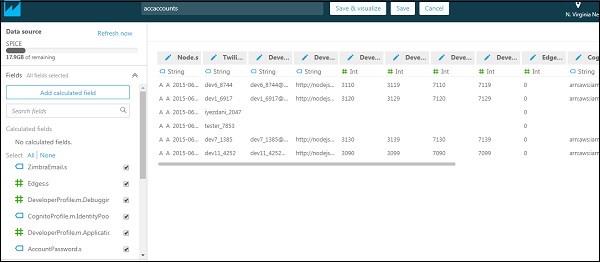
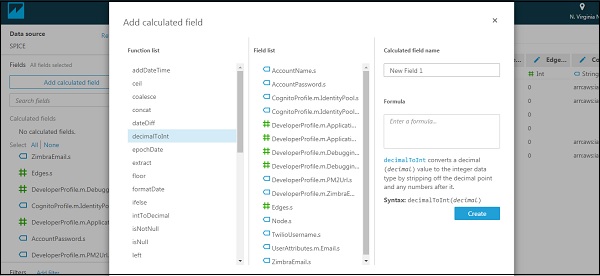
There is an option of adding calculated fields as well. You can use inbuilt functions on input fields to create a new field. There are number of options like concatenating multiple fields, unstring a single field into multiple fields, time difference between to dates and so on. The complete list is shown below −
Once you are done with adding or modifying fields, just click “Save and Visualize” or just “Save” at the top. The “Save” button will keep you on existing screen while “Save and Visualize” will take you to the visual creation screen.
To cancel your changes, click on Cancel button at the top.
AWS Quicksight - Creating New Analysis
An analysis is a combination of one or more visuals. A visual is the representation of data in graphical, chart or tabular format. There are number of formats available to create any visual. This includes the pie charts, horizontal bar chart, vertical bar chart and pivot table.
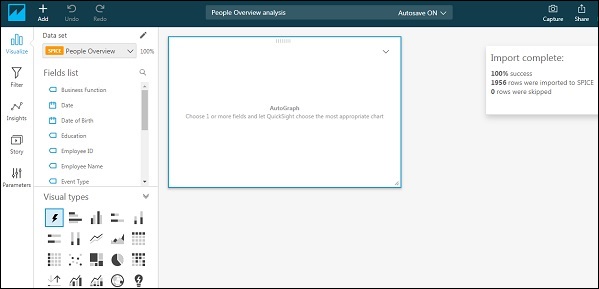
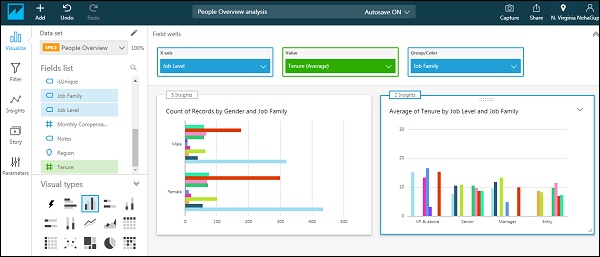
Once the input data set has been modified as per business requirement, double click on the dataset and click on visualize to start creating new analysis. It will show you the below screen or the workspace.
Once you select a field, Quicksight automatically chooses the type of visual depending upon the field. If you want to change the visual type, you can select one of the visual types.
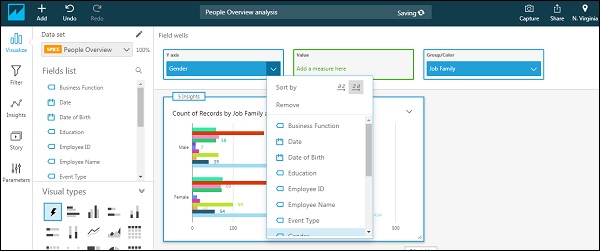
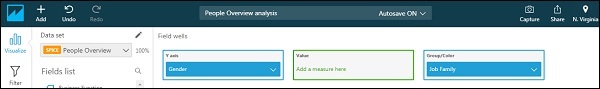
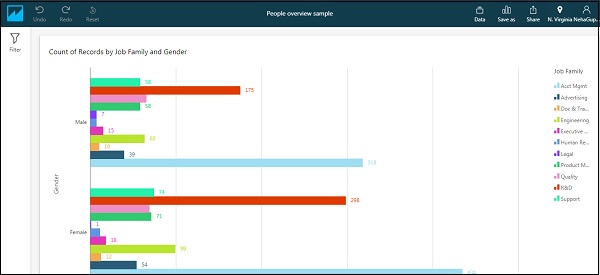
For example, we start by selecting the Horizontal bar under visual types. First, drag any one field inside the visual in the centre. At the top, you will see “Fields wells” containing fields used in visual and the corresponding axis. You can click on the down arrow at the last just under user name.

This will give you an expanded view. I have selected Gender on Y axis and Job family under Group/colour. You can modify the fields from dropdown. Under value, you can add any numeric field and use aggregate function on that field. By default, the visual will show count of rows.
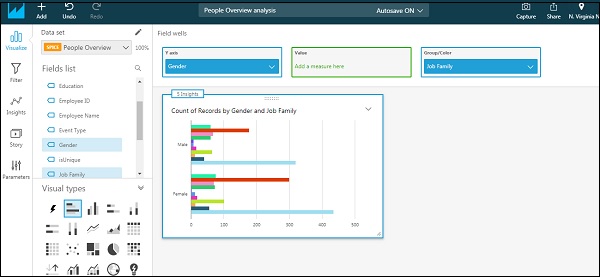
The visual will appear as follows −
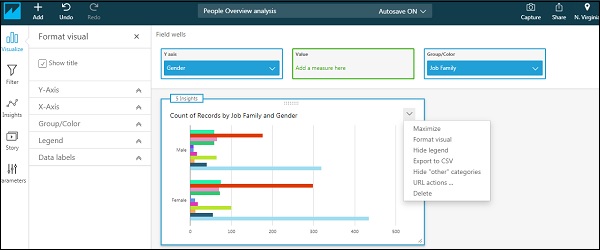
There are options to change the heading/title of the visual and number of other formatting options. Click the dropdown on the right most. The options will expand. Choose “format visual”. You will be able to see various options in left tab under “Format visual”.
X-Axis/Y-Axis − This gives the option if you want to see the label or field name on the respective axis. It also allows you to rename these labels.
Group/Color − This provides the option to change the default colors in the visual.
Legend − This provides the options to change title and position of title in the visual. You can also rename the title by just clicking over it.
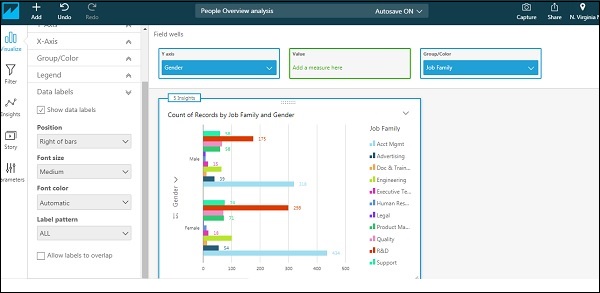
Data labels − This provides the option to show exact values of each bar and the position where the values needs to be displayed.
The below screen shows the visual with everything turned on −
AWS Quicksight - Adding Visuals
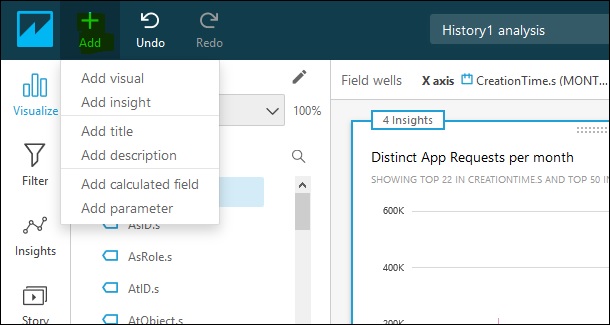
To add a new visual, click on the “Add” sign at the top. Another rectangular space would be added to the analysis. You can select different visual types and fields to create another visual.
When you click on Add button, you have the option to add following to your existing analysis −
- Add Visual
- Add Insight
- Add Title
- Add Description
- Add Calculation Field
- Add Parameter
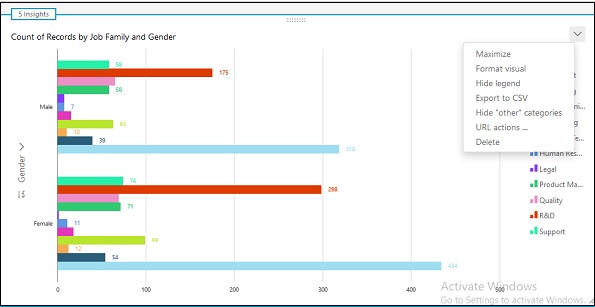
To format a visual, you can also use drop down arrow button available at top right corner of the chart. Following options are available −
- Maximize
- Format visual
- Hide legend
- Export to CSV
- Hide “other” categories
- URL actions
- Delete
AWS Quicksight - Using Filters to a Visual
Quicksight allows you to add filters to the visual being created. You have the option to apply filter to only a single visual under any analysis or all the visuals. To add filter, click on “Filter” icon on the left tab. It will show existing filter if there is any or filter can be created as per the requirement. In the below example, we don’t have any existing filters, so it gave an option to “Create one”
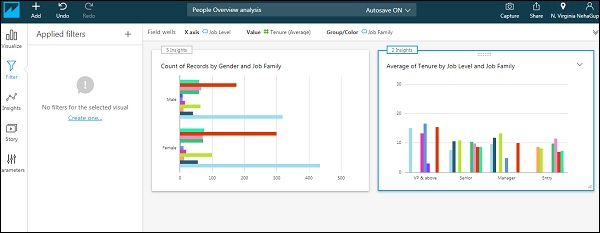
On clicking create one, you can create filter. This allows you to choose if you want to add filter to just one or all the visuals. It also allows you to choose the field on which you want to apply filter.
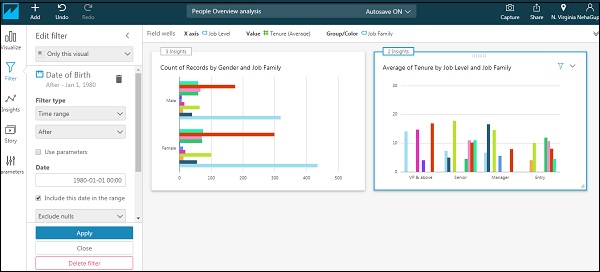
In the above example, we have added a filter on “Date of Birth” field on input dataset and specified a Date. Now, the visual contains the average tenure of employees under different job level and job family but only including employees whose Date of Birth is after 1980-01-01.
AWS Quicksight - Insights
Amazon uses its machine learning capabilities to analyze your data and provide insights. The insights show you the trends in the data, help in forecasting business metrics and identify key drivers. It saves lot of your time to analyze and create them manually. With the help of insights, you can easily understand various points which help you to determine and make best decisions, and achieve your goals.
Once you click on the Insights, the left panel displays the automatically calculated and created insights by Quicksight under “Suggested Insights
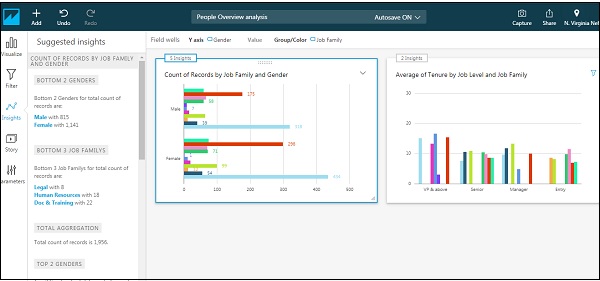
If you hover on the right of each insight heading, you will see a “+” sign and 3 dotes. The “+” sign is used to add the insight to your analysis while the 3 dotes gives you option to add in filters to existing insights. To add an insight, click on the “Add” sign at the top and click on “Add insights”.
You can further choose the computation type you want to perform and add that insight to your analysis. “Forecast” and Anomaly detection are powered by machine learning and are available in “Enterprise edition” of Quicksight

AWS Quicksight - Creating Story
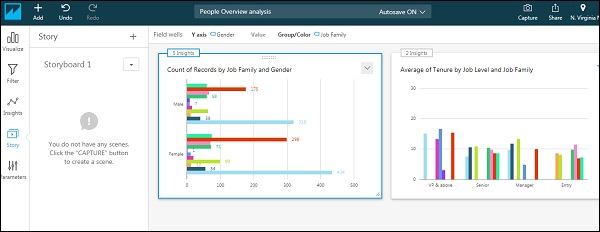
Story is an option wherein you capture a series of screens and play them one by one. For example, if you want to see a visual with different filter options, you can use story. To create a Story, click on Story on the leftmost panel. By default, there is a story with name Storyboard 1. Now capture the screen using the capture icon at the right most panel on the top. Each capture of the screen is also referred to as Scene. You can capture multiple scenes and those will get added under “Storyboard 1”. The data in the story gets automatically refreshed once your main data source is refreshed.
AWS Quicksight - Using Parameters
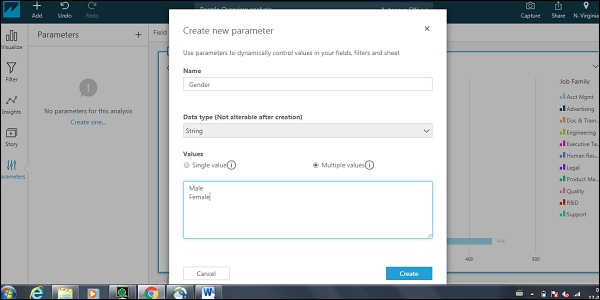
Parameters are variables that are created to pass control of the user to modify the dashboards. Parameters can be created using the fields of the input data set or on the filters created for analysis. For example, you create a parameter using a filter, the dashboard users can directly apply filter without creating any filter.
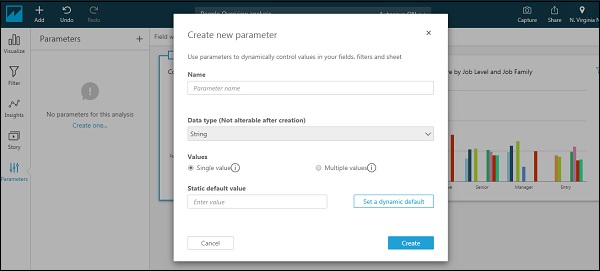
Creating a Parameter
In this section, we will see how to create a parameter −
Step 1 − Enter the name of parameter. Let us take Gender as parameter.
Step 2 − Choose data type. By default, it is string.
Step 3 − Choose the possible options as below.
The parameter would be added. You can choose to add control to the dashboard.
AWS Quicksight - Sharing Analysis
Once the analysis is ready, this can be shared with users by email or other Quicksight users. On the top right side menu, there is a “Share” icon
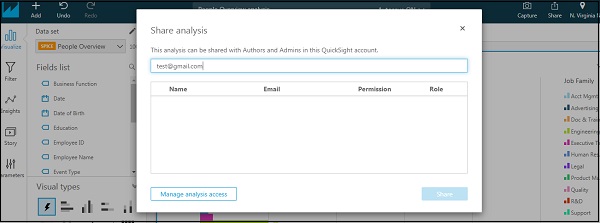
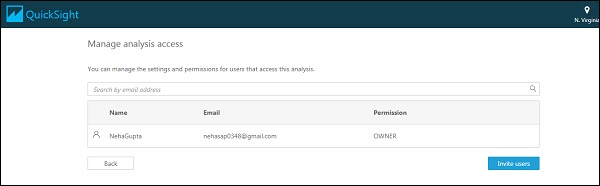
By default, the analysis can be accessed by the author or admin only. You would require providing access to the user to be able to view the analysis. On clicking “Manage analysis access”, it will show all the registered users. You can choose the users you want to extend the access and click on “Invite users”. The users will get an email notification and once they accept the notification, they will be able to get analysis by email.
AWS Quicksight - Dashboards
A dashboard shows the screenshot of the analysis. Unlike Analysis, dashboards are read as only screenshots. One can just use the parameters and filters created in visuals to create new visuals but with same charts
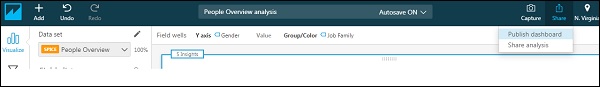
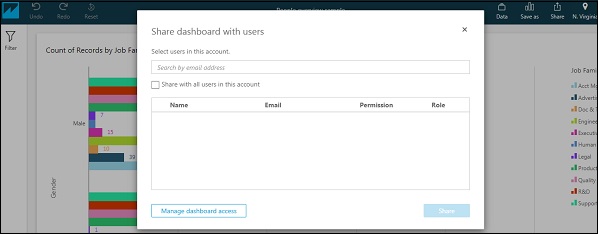
To generate a dashboard of the analysis you have created, just click on publish dashboard under share icon. Provide any name to the dashboard and click on “Publish Dashboard” icon.
You can opt to share the dashboard with all users in this account or only particular users.
Now the dashboard is visible under “All dashboards” tab on home screen.
Here is the sample dashboard with a filter attached to it. You can see that there is no option to edit the dashboard except applying filters added while creating visuals.
AWS Quicksight - Managing Quicksight
Manage Quicksight is to manage your current account. You can add users with respective roles, manage your subscription, and check SPICE capacity or whitelist domains for embedding. You would require admin access to perform any activity on this page.
Under the user profile, you will find the option to manage Quicksight.

On clicking Manage subscription, below screen will appear. It will show the users in this account and their respective roles.
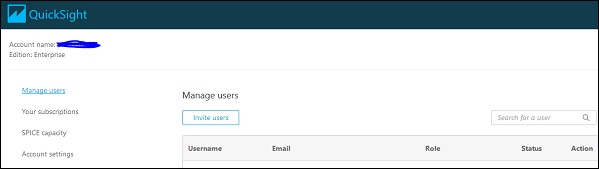
You also have a search option; in case you want to particularly search for an existing user in Quicksight.
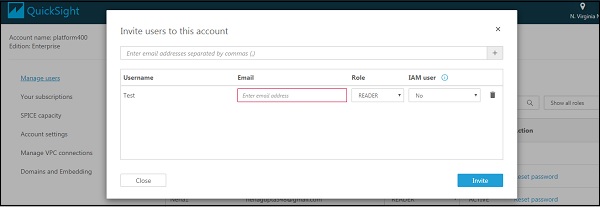
You can invite users with valid email address or you can add users with a valid IAM account. The users with IAM role can then login to their Quicksight account and view the dashboard to which they have access.
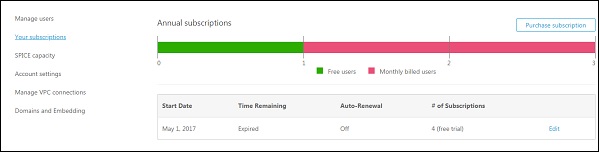
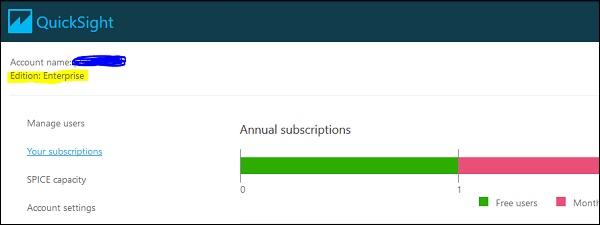
Your Subscriptions will show the edition of Quicksight you are subscribed to.
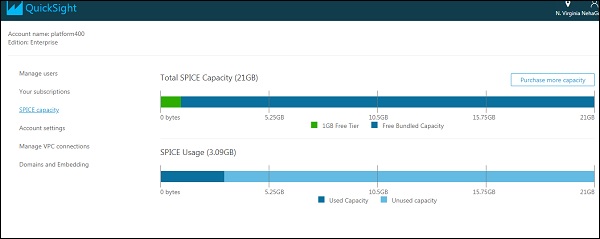
SPICE capacity shows the capacity of their calculation engine being opted for and the amount used so far. There is an option of purchasing more capacity if required.
Account settings shows details of Quicksight account − notification email address, AWS resource permissions to Quicksight, or you also have an option to close the account.
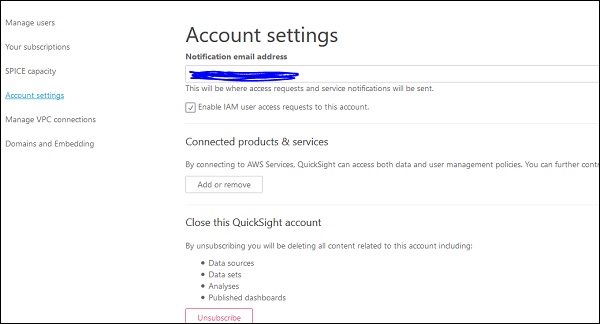
When you close Quicksight account, it deletes all the data related to below objects −
- Data Sources
- Data Sets
- Analyses
- Published Dashboards
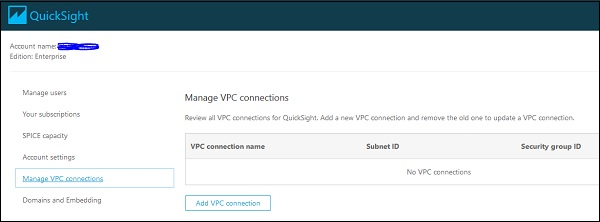
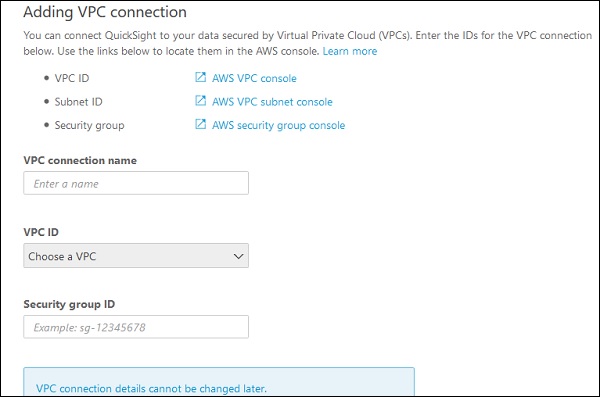
Manage VPC connection allows you to manage and add VPC connection to Quicksight. To add a new VPC connection, you need to provide the following details −
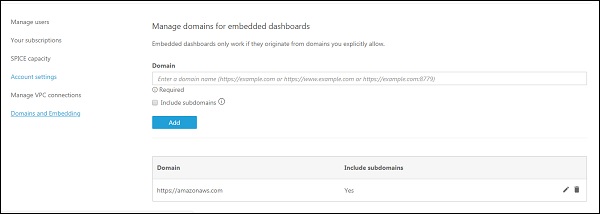
Domains and embedding allows you to whitelist the domain on which you want to embed Quicksight dashboards for the users. It only supports https:// domain to whitelist in Quicksight −
You can also include any subdomains if you want to use by selecting the checkbox shown below. When you click on Add button, it adds the domain to the list of domain names allowed in Quicksight for embedding.
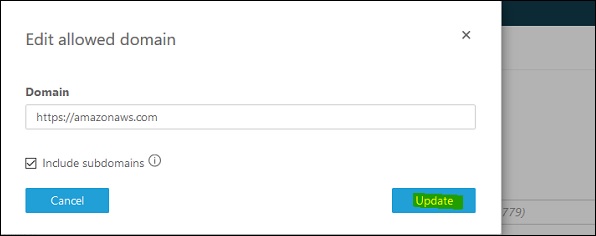
To edit an allowed domain, you need to click on Edit button located beside the domain name. You can make changes and click on Update.
AWS Quicksight - Edition Type
AWS Quicksight supports different editions which vary as per user management, permissions and features supported − Standard and Enterprise. Both of these editions support all the Quicksight features for creating and sharing data visualizations.
Enterprise edition offers support for Active Directory integration to AWS directory. There are various other features which are supported in Enterprise edition as given below −
| Features Supported | Standard Edition | Enterprise Edition |
|---|---|---|
| # of Free Authors | 1 | 1 |
| # of Free Trial Authors (60Days) | 4 | 4 |
| Included SPICE Capacity | 10 GB/User | 10 GB/User |
| Readers | N/A | $0.30/session |
| Additional SPICE Capacity | $0.25/GB/mo. | $0.38/GB/mo. |
| Connect to spreadsheets, databases, data lakes, and business apps | ✓ | ✓ |
| Easily analyze data with AutoGraph | ✓ | ✓ |
| Fast, scalable visualizations | ✓ | ✓ |
| Publish dashboards for interactive data access | ✓ | ✓ |
| Single-Sign-On with SAML or OpenID Connect | ✓ | ✓ |
| Web and mobile access | ✓ | ✓ |
| Drill-down to detail and customize filters | ✓ | ✓ |
| Enable audit logs with AWS CloudTrail | ✓ | ✓ |
| Reader Role | ✓ | |
| Securely Access data in Private VPCs and On-Prem | ✓ | |
| Row Level Security | ✓ | |
| Hourly refresh of SPICE data | ✓ | |
| Secure data encryption at rest | ✓ | |
| Connect to Active Directory | ✓ | |
| Use Active Directory groups | ✓ |
You can check the subscription type of AWS Quicksight with Manage Quicksight option.
In Enterprise edition, AWS Quicksight allows you to manage users using any of the below ways −
Using Microsoft Active Directory: In Enterprise edition, you can add/remove Microsoft Active Directory groups to create and deactivate user accounts. You can access the directory groups directly or by using the AD Connector.
Federated logins.
Inviting users by email.
To manage your AD users/groups in Quicksight, you have to navigate to Manage Quicksight → Manage users/Manage groups
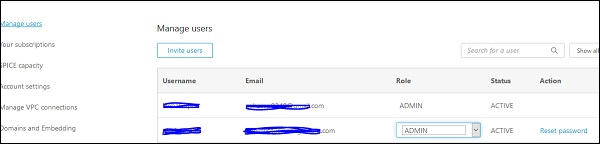
You can also change the role of an existing user by clicking on drop down list −
- Admin
- Author
- Reader
An AWS Quicksight administrator can also reset the password of an existing user using Manage User option as shown below −
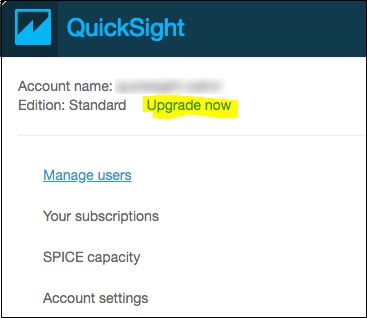
You can update from AQS Quicksight Standard edition to Enterprise edition using Manage account option. To perform an upgrade, the user should have AWS Quicksight administrator privilege.
Click on your profile icon at top right corner → Upgrade now.
Once you click on Upgrade, following screen appears. To complete the upgrade, click on the Upgrade button.
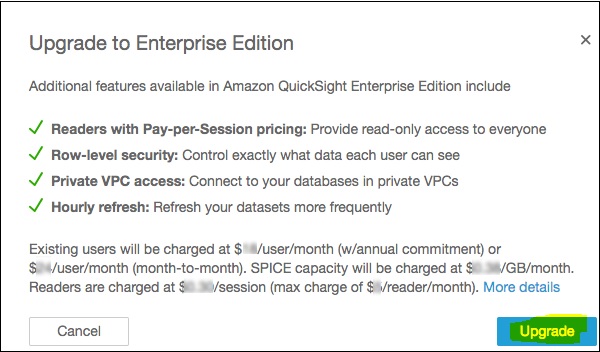
Note − Once you change your subscription from Standard edition to Enterprise edition, you cannot roll it back.
AWS Quicksight - Managing IAM Policies
To manage IAM policies for Quicksight account, you can use root user or IAM credentials. It is recommended to use IAM credentials to manage resource access and policies instead of root user.
Following policies are required to signup and use Amazon Quicksight −
Standard Edition
- ds:AuthorizeApplication
- ds:CheckAlias
- ds:CreateAlias
- ds:CreateIdentityPoolDirectory
- ds:DeleteDirectory
- ds:DescribeDirectories
- ds:DescribeTrusts
- ds:UnauthorizeApplication
- iam:CreatePolicy
- iam:CreateRole
- iam:ListAccountAliases
- quicksight:CreateUser
- quicksight:CreateAdmin
- quicksight:Subscribe
Enterprise Edition
Apart from the above mentioned policies, below permissions are required in enterprise edition −
- quicksight:GetGroupMapping
- quicksight:SearchDirectoryGroups
- quicksight:SetGroupMapping
You can also allow a user to manage permissions for AWS resources in Quicksight. Following IAM policies should be assigned in both editions −
- iam:AttachRolePolicy
- iam:CreatePolicy
- iam:CreatePolicyVersion
- iam:CreateRole
- iam:DeletePolicyVersion
- iam:DeleteRole
- iam:DetachRolePolicy
- iam:GetPolicy
- iam:GetPolicyVersion
- iam:GetRole
- iam:ListAttachedRolePolicies
- iam:ListEntitiesForPolicy
- iam:ListPolicyVersions
- iam:ListRoles
- s3:ListAllMyBuckets
To prevent an AWS administrator to unsubscribe from Quicksight, you can deny all users “quicksight:Unsubscribe”
IAM policy for dashboard embedding
To embed an AWS Quciksight dashboard URL in web page, you need the following IAM policies to be assigned to the user −
{
   "Version": "2012-10-17",
   "Statement": [
      {
         "Action": "quicksight:RegisterUser",
         "Resource": "*",
         "Effect": "Allow"
      },
      {
         "Action": "quicksight:GetDashboardEmbedUrl",
         "Resource": "arn:aws:quicksight:us-east-1:
         868211930999:dashboard/
         f2cb6cf2-477c-45f9-a1b3-639239eb95d8 ",
         "Effect": "Allow"
      }
   ]
}
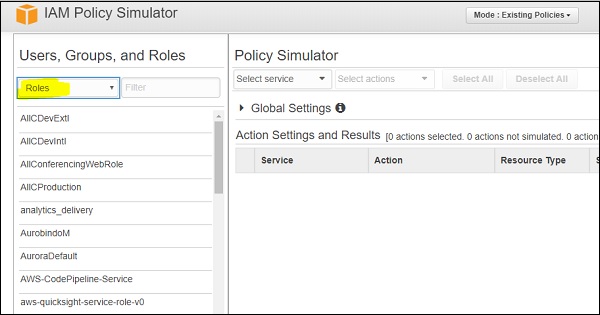
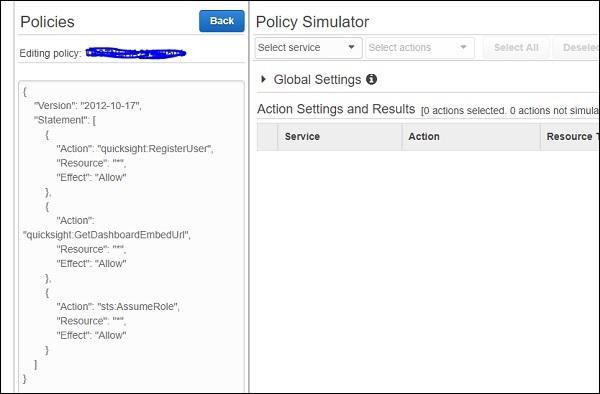
You can manage and test these roles and policies using IAM policy simulator in Quicksight. Below is the link to access IAM Policy simulator −
https://policysim.aws.amazon.com/home/index.jsp?#
AWS Quicksight - Embedding Dashboard
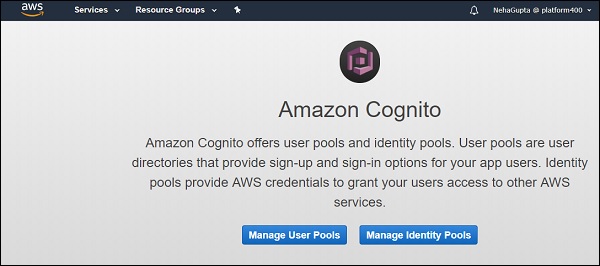
You can also embed your Quicksight dashboards into external applications/web pages or can control user access using AWS Cognito service. To perform user control, you can create user pool and identity pool in Cognito and assign Embed dashboard policies to identity pool.
AWS Cognito is an IAM service which allows administrators to create and manage temporary users to provide access to applications. With the use of identity pool, you can manage permissions on these user pools.
Let us see how we can generate secure dashboard URL and perform user control −
Step 1 - Creating user pools and users
Create user pool in AWS Cognito and create users. Go to Amazon Cognito → Manage User Pools → Create a User Pool.
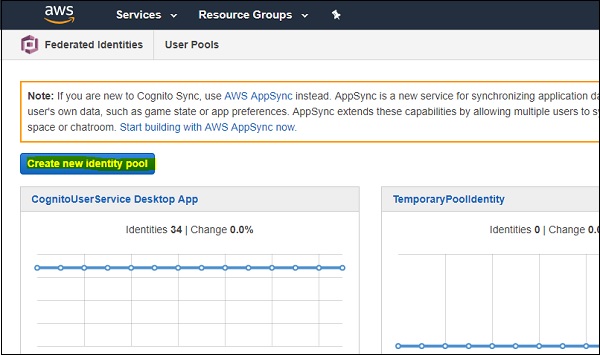
Step 2 - Creating an identity pool
When user pool is created, next step is to create an identity pool. Go to https://console.aws.amazon.com/cognito/home?region=us-east-1
Click on “Create New Identity Pool”.
Enter the appropriate name of an identity pool. Go to the Authentication Providers section and select “Cognito” option.
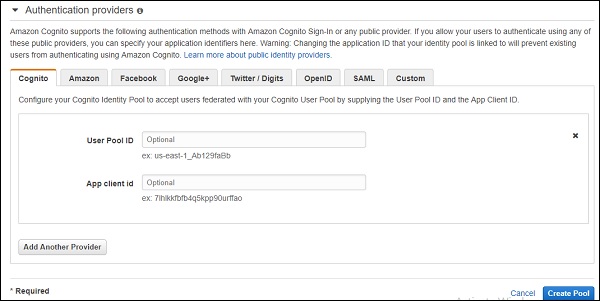
Step 3 - Creating Cognito roles
Enter the User Pool ID (your User pool ID) and App Client ID (go to App Clients in user pool and copy id).
Next is to click on ‘Create Pool’ and click on ‘Allow’ to create roles of the identity pool in IAM. It will create 2 Cognito roles.
Step 4 - Assigning Custom Policy
Next step is to assign custom policy to identity roles created in the above step −
{
   "Version": "2012-10-17",
   "Statement": [
      {
         "Action": "quicksight:RegisterUser",
         "Resource": "*",
         "Effect": "Allow"
      },
      {
         "Action": "quicksight:GetDashboardEmbedUrl",
         "Resource": "*",
         "Effect": "Allow"
      },
      {
         "Action": "sts:AssumeRole",
         "Resource": "*",
         "Effect": "Allow"
      }
   ]
}
You can pass dashboard Amazon Resource Name (ARN) under quicksight:GetDashboardEmbedUrl” instead of “*” to restrict user to access only one dashboard.
Step 5 - Logging into Cognito application
Next step is to login to Cognito application with user credentials in user pool. When user logins into application, Cognito generates 3 tokens −
- IDToken
- AccessToken
- Refresh Token
To create a temporary IAM user, credentials are as shown below −
AWS.config.region = 'us-east-1';
AWS.config.credentials = new AWS.CognitoIdentityCredentials({
   IdentityPoolId:"Identity pool ID", Logins: {
      'cognito-idp.us-east-1.amazonaws.com/UserPoolID': AccessToken
   }
});
For generating temporary IAM credentials, you need to call sts.assume role method with the below parameters −
var params = {
   RoleArn: "Cognito Identity role arn", RoleSessionName: "Session name"
};
sts.assumeRole(params, function (err, data) {
   if (err) console.log( err, err.stack);
   // an error occurred
   else {
      console.log(data);
   })
}
Step 6 - Registering the user in Quicksight
Next step is to register the user in Quicksight using “quicksight.registerUser” for credentials generated in step 3 with the below parameters −
var params = {
   AwsAccountId: “account id”,
   Email: 'email',
   IdentityType: 'IAM' ,
   Namespace: 'default',
   UserRole: ADMIN | AUTHOR | READER | RESTRICTED_AUTHOR | RESTRICTED_READER,
   IamArn: 'Cognito Identity role arn',
   SessionName: 'session name given in the assume role creation',
};
quicksight.registerUser(params, function (err, data1) {
   if (err) console.log("err register user”);
   // an error occurred
   else {
      // console.log("Register User1”);
   }
})
Step 7 - Updating AWS Configuration file
Next is to update AWS configuration for user generated in step 5.
AWS.config.update({
   accessKeyId: AccessToken,
   secretAccessKey: SecretAccessKey ,
   sessionToken: SessionToken,
   "region": Region
});
Step 8 - Generating embed URL for Quicksight dashboard
With credentials created in step 5, call the quicksight.getDashboardEmbedUrl with the below parameters to generate URL.
var params = {
   AwsAccountId: "Enter AWS account ID",
   DashboardId: "Enter dashboard Id",
   IdentityType: "IAM",
   ResetDisabled: true,
   SessionLifetimeInMinutes: between 15 to 600 minutes,
   UndoRedoDisabled: True | False
}
quicksight.getDashboardEmbedUrl(params,function (err, data) {
   if (!err) {
      console.log(data);
   } else {
      console.log(err);
   }
});
You have to call “QuickSightEmbedding.embedDashboard” from your application using the above generated URL.
Like Amazon Quicksight, embedded dashboard also supports the following features −
- Drill-down option
- Custom actions (link to a new tab)
- On-screen filters
- Download to CSV
- Sorting on visuals
- Email report opt-in
- Reset dashboard to defaults option
- Undo/redo actions on the dashboard
AWS Quicksight - AWS SDKs
You can use AWS Quicksight SDK’s to manage the following −
- User and group management
- Embedding dashboards
Following shows a sample HTML code to be used to display an embedded dashboard −
<!DOCTYPE html>
<html>
   <head>
      <title>Sample Embed</title>
      <script type="text/javascript" src="https://unpkg.com/amazon-quicksight-embedding-sdk@1.0.1/dist/quicksight-embedding-js-sdk.min.js"></script>
      <script type="text/javascript">
         function embedDashboard() {
            var containerDiv = document.getElementById("dashboardContainer");
            var params = {
               url: "https://us-east-1.quicksight.aws.amazon.com/sn/dashboards/xxx-x-x-xx-x-x-x-x-x-x-x-xx-xx-x-xx",
               container: containerDiv,
               parameters: {
                  country: 'United States'
               },
               height: "600px",
               width: "800px"
            };
            var dashboard = QuickSightEmbedding.embedDashboard(params);
            dashboard.on('error', function() {});
            dashboard.on('load', function() {});
            dashboard.setParameters({country: 'Canada'});
         }
      </script>
   </head>
<html>
To use AWS SDK’s, you should be familiar with the following −
JSON
Web services
HTTP requests
One or more programming languages, such as JavaScript, Java, Python, or C#.
AWS Quicksight - Developer Responsibilities
Following job responsibilities are performed by an AWS Quicksight developer −
Person should have relevant work experience in analytics, reporting and business intelligence tools.
Understanding customer requirements and design solution in AWS to setup ETL and Business Intelligence environment.
Understanding different AWS services, their use and configuration.
Proficient in using SQL, ETL, Data Warehouse solutions and databases in a business environment with large-scale, disparate datasets.
Complex quantitative and data analysis skills.
Understanding AWS IAM policies, roles and administrator of AWS services.