- AWS Quicksight Tutorial
- AWS Quicksight - Home
- AWS Quicksight - Overview
- AWS Quicksight - Landing Page
- AWS Quicksight - Using Data Sources
- AWS Quicksight - Data Source Limit
- AWS Quicksight - Editing Datasets
- AWS Quicksight - Creating New Analysis
- AWS Quicksight - Adding Visuals
- Using Filters to a Visual
- AWS Quicksight - Insights
- AWS Quicksight - Creating Story
- AWS Quicksight - Using Parameters
- AWS Quicksight - Sharing Analysis
- AWS Quicksight - Dashboards
- AWS Quicksight - Managing Quicksight
- AWS Quicksight - Edition Type
- AWS Quicksight - Managing IAM Policies
- AWS Quicksight - Embedding Dashboard
- AWS Quicksight - AWS SDKs
- Developer Responsibilities
- AWS Quicksight Useful Resources
- AWS Quicksight - Quick Guide
- AWS Quicksight - Useful Resources
- AWS Quicksight - Discussion
AWS Quicksight - Adding Visuals
To add a new visual, click on the “Add” sign at the top. Another rectangular space would be added to the analysis. You can select different visual types and fields to create another visual.
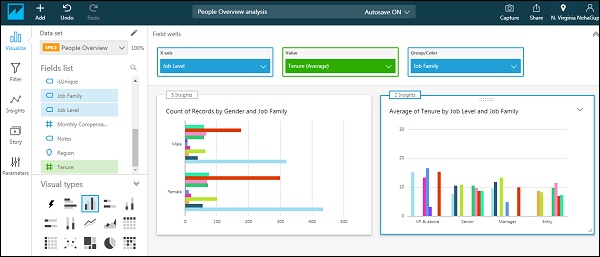
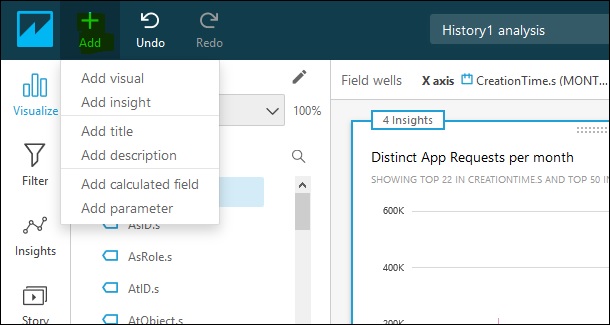
When you click on Add button, you have the option to add following to your existing analysis −
- Add Visual
- Add Insight
- Add Title
- Add Description
- Add Calculation Field
- Add Parameter
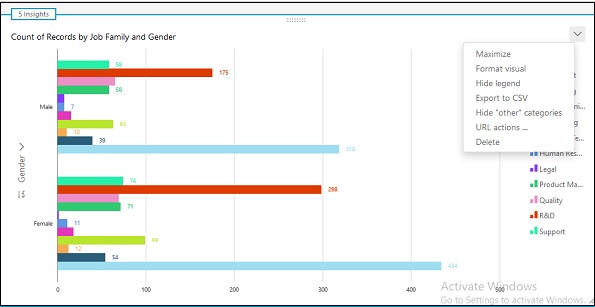
To format a visual, you can also use drop down arrow button available at top right corner of the chart. Following options are available −
- Maximize
- Format visual
- Hide legend
- Export to CSV
- Hide “other” categories
- URL actions
- Delete
Advertisements