- Agile Data Science Tutorial
- Agile Data Science - Home
- Agile Data Science - Introduction
- Methodology Concepts
- Agile Data Science - Process
- Agile Tools & Installation
- Data Processing in Agile
- SQL versus NoSQL
- NoSQL & Dataflow programming
- Collecting & Displaying Records
- Data Visualization
- Data Enrichment
- Working with Reports
- Role of Predictions
- Extracting features with PySpark
- Building a Regression Model
- Deploying a predictive system
- Agile Data Science - SparkML
- Fixing Prediction Problem
- Improving Prediction Performance
- Creating better scene with agile & data science
- Implementation of Agile
- Agile Data Science Useful Resources
- Agile Data Science - Quick Guide
- Agile Data Science - Resources
- Agile Data Science - Discussion
Agile Data Science - Working with Reports
In this chapter, we will learn about report creation, which is an important module of agile methodology. Agile sprints chart pages created by visualization into full-blown reports. With reports, charts become interactive, static pages become dynamic and network related data. The characteristics of reports stage of the data value pyramid is shown below −

We will lay more stress on creating csv file, which can be used as report for data science analysis, and drawing conclusion. Although agile focusses on less documentation, generating reports to mention the progress of product development is always considered.
import csv
#----------------------------------------------------------------------
def csv_writer(data, path):
   """
      Write data to a CSV file path
   """
   with open(path, "wb") as csv_file:
   writer = csv.writer(csv_file, delimiter=',')
   for line in data:
   writer.writerow(line)
#----------------------------------------------------------------------
if __name__ == "__main__":
   data = ["first_name,last_name,city".split(","),
      "Tyrese,Hirthe,Strackeport".split(","),
      "Jules,Dicki,Lake Nickolasville".split(","),
      "Dedric,Medhurst,Stiedemannberg".split(",")
   ]

   path = "output.csv"
   csv_writer(data, path)
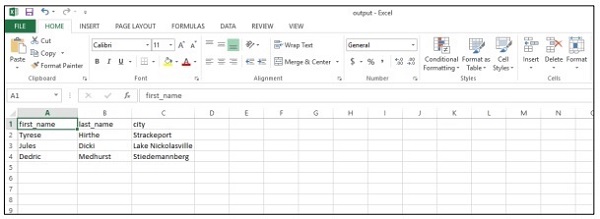
The above code will help you generate the “csv file” as shown below −
Let us consider the following benefits of csv (comma- separated values) reports −
- It is human friendly and easy to edit manually.
- It is simple to implement and parse.
- CSV can be processed in all applications.
- It is smaller and faster to handle.
- CSV follows a standard format.
- It provides straightforward schema for data scientists.