- Agile Data Science Tutorial
- Agile Data Science - Home
- Agile Data Science - Introduction
- Methodology Concepts
- Agile Data Science - Process
- Agile Tools & Installation
- Data Processing in Agile
- SQL versus NoSQL
- NoSQL & Dataflow programming
- Collecting & Displaying Records
- Data Visualization
- Data Enrichment
- Working with Reports
- Role of Predictions
- Extracting features with PySpark
- Building a Regression Model
- Deploying a predictive system
- Agile Data Science - SparkML
- Fixing Prediction Problem
- Improving Prediction Performance
- Creating better scene with agile & data science
- Implementation of Agile
- Agile Data Science Useful Resources
- Agile Data Science - Quick Guide
- Agile Data Science - Resources
- Agile Data Science - Discussion
Agile Data Science - Quick Guide
Agile Data Science - Introduction
Agile data science is an approach of using data science with agile methodology for web application development. It focusses on the output of the data science process suitable for effecting change for an organization. Data science includes building applications that describe research process with analysis, interactive visualization and now applied machine learning as well.
The major goal of agile data science is to −
document and guide explanatory data analysis to discover and follow the critical path to a compelling product.
Agile data science is organized with the following set of principles −
Continuous Iteration
This process involves continuous iteration with creation tables, charts, reports and predictions. Building predictive models will require many iterations of feature engineering with extraction and production of insight.
Intermediate Output
This is the track list of outputs generated. It is even said that failed experiments also have output. Tracking output of every iteration will help creating better output in the next iteration.
Prototype Experiments
Prototype experiments involve assigning tasks and generating output as per the experiments. In a given task, we must iterate to achieve insight and these iterations can be best explained as experiments.
Integration of data
The software development life cycle includes different phases with data essential for −
customers
developers, and
the business
The integration of data paves way for better prospects and outputs.
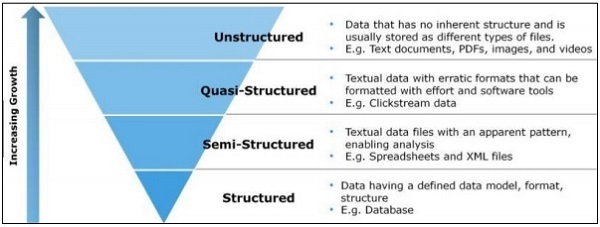
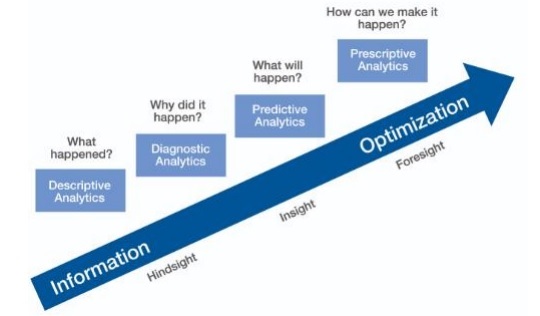
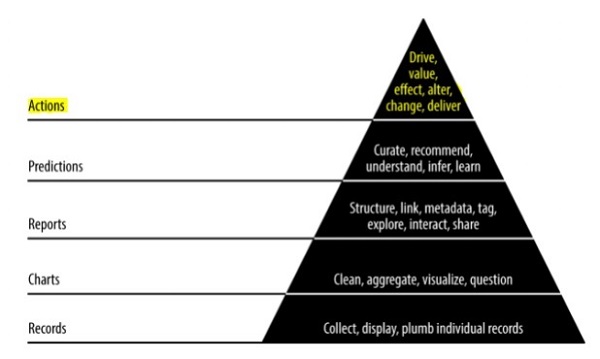
Pyramid data value
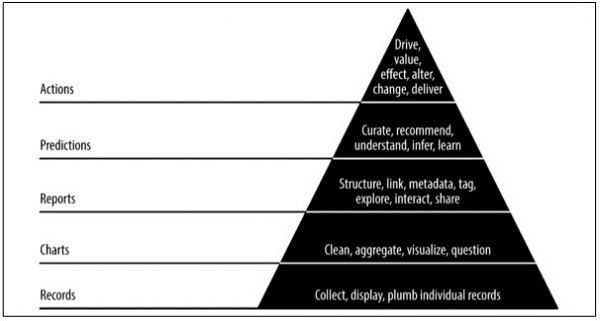
The above pyramid value described the layers needed for “Agile data science” development. It starts with a collection of records based on the requirements and plumbing individual records. The charts are created after cleaning and aggregation of data. The aggregated data can be used for data visualization. Reports are generated with proper structure, metadata and tags of data. The second layer of pyramid from the top includes prediction analysis. The prediction layer is where more value is created but helps in creating good predictions that focus on feature engineering.
The topmost layer involves actions where the value of data is driven effectively. The best illustration of this implementation is “Artificial Intelligence”.
Agile Data Science - Methodology Concepts
In this chapter, we will focus on the concepts of software development life cycle called “agile”. The Agile software development methodology helps in building a software through increment sessions in short iterations of 1 to 4 weeks so the development is aligned with changing business requirements.
There are 12 principles that describe the Agile methodology in detail −
Satisfaction of customers
The highest priority is given to customers focusing on the requirements through early and continuous delivery of valuable software.
Welcoming new changes
Changes are acceptable during software development. Agile processes is designed to work in order to match the customer’s competitive advantage.
Delivery
Delivery of a working software is given to clients within a span of one to four weeks.
Collaboration
Business analysts, quality analysts and developers must work together during the entire life cycle of project.
Motivation
Projects should be designed with a clan of motivated individuals. It provides an environment to support individual team members.
Personal conversation
Face-to-face conversation is the most efficient and effective method of sending information to and within a development team.
Measuring progress
Measuring progress is the key that helps in defining the progress of project and software development.
Maintaining constant pace
Agile process focusses on sustainable development. The business, the developers and the users should be able to maintain a constant pace with the project.
Monitoring
It is mandatory to maintain regular attention to technical excellence and good design to enhance the agile functionality.
Simplicity
Agile process keeps everything simple and uses simple terms to measure the work that is not completed.
Self-organized terms
An agile team should be self-organized and should be independent with the best architecture; requirements and designs emerge from self-organized teams.
Review the work
It is important to review the work at regular intervals so that the team can reflect on how the work is progressing. Reviewing the module on a timely basis will improve performance.
Daily Stand-up
Daily stand-up refers to the daily status meeting among the team members. It provides updates related to the software development. It also refers to addressing obstacles of project development.
Daily stand-up is a mandatory practice, no matter how an agile team is established regardless of its office location.
The list of features of a daily stand-up are as follows −
The duration of daily stand-up meet should be roughly 15 minutes. It should not extend for a longer duration.
Stand-up should include discussions on status update.
Participants of this meeting usually stand with the intention to end up meeting quickly.
User Story
A story is usually a requirement, which is formulated in few sentences in simple language and it should be completed within an iteration. A user story should include the following characteristics −
All the related code should have related check-ins.
The unit test cases for the specified iteration.
All the acceptance test cases should be defined.
Acceptance from product owner while defining the story.
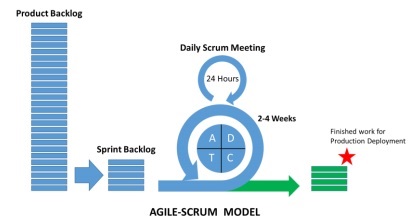
What is Scrum?
Scrum can be considered as a subset of agile methodology. It is a lightweight process and includes the following features −
It is a process framework, which includes a set of practices that need to be followed in consistent order. The best illustration of Scrum is following iterations or sprints.
It is a “lightweight” process meaning that the process is kept as small as possible, to maximize the productive output in given duration specified.
Scrum process is known for its distinguishing process in comparison with other methodologies of traditional agile approach. It is divided into the following three categories −
Roles
Artifacts
Time Boxes
Roles define the team members and their roles included throughout the process. The Scrum Team consists of the following three roles −
Scrum Master
Product Owner
Team
The Scrum artifacts provide key information that each member should be aware of. The information includes details of product, activities planned, and activities completed. The artefacts defined in Scrum framework are as follows −
Product backlog
Sprint backlog
Burn down chart
Increment
Time boxes are the user stories which are planned for each iteration. These user stories help in describing the product features which form part of the Scrum artefacts. The product backlog is a list of user stories. These user stories are prioritized and forwarded to the user meetings to decide which one should be taken up.
Why Scrum Master?
Scrum Master interacts with every member of the team. Let us now see the interaction of the Scrum Master with other teams and resources.
Product Owner
The Scrum Master interacts the product owner in following ways −
Finding techniques to achieve effective product backlog of user stories and managing them.
Helping team to understand the needs of clear and concise product backlog items.
Product planning with specific environment.
Ensuring that product owner knows how to increase the value of product.
Facilitating Scrum events as and when required.
Scrum Team
The Scrum Master interacts with the team in several ways −
Coaching the organization in its Scrum adoption.
Planning Scrum implementations to the specific organization.
Helping employees and stakeholders to understand the requirement and phases of product development.
Working with Scrum Masters of other teams to increase effectiveness of the application of Scrum of the specified team.
Organization
The Scrum Master interacts with organization in several ways. A few are mentioned below −
Coaching and scrum team interacts with self-organization and includes a feature of cross functionality.
Coaching the organization and teams in such areas where Scrum is not fully adopted yet or not accepted.
Benefits of Scrum
Scrum helps customers, team members and stakeholders collaborate. It includes timeboxed approach and continuous feedback from the product owner ensuring that the product is in working condition. Scrum provides benefits to different roles of the project.
Customer
The sprints or iterations are considered for shorter duration and user stories are designed as per priority and are taken up at sprint planning. It ensures that every sprint delivery, customer requirements are fulfilled. If not, the requirements are noted and are planned and taken for sprint.
Organization
Organization with the help of Scrum and Scrum masters can focus on the efforts required for development of user stories thus reducing work overload and avoiding rework if any. This also helps in maintaining increased efficiency of development team and customer satisfaction. This approach also helps in increasing the potential of the market.
Product Managers
The main responsibility of the product managers is to ensure that the quality of product is maintained. With the help of Scrum Masters, it becomes easy to facilitate work, gather quick responses and absorb changes if any. Product managers also verify that the designed product is aligned as per the customer requirements in every sprint.
Development Team
With time-boxed nature and keeping sprints for a smaller duration of time, development team becomes enthusiastic to see that the work is reflected and delivered properly. The working product increments each level after every iteration or rather we can call them as “sprint”. The user stories which are designed for every sprint become customer priority adding up more value to the iteration.
Conclusion
Scrum is an efficient framework within which you can develop software in teamwork. It is completely designed on agile principles. ScrumMaster is there to help and co-operate the team of Scrum in every possible way. He acts like a personal trainer who helps you stick with designed plan and perform all the activities as per the plan. The authority of ScrumMaster should never extend beyond the process. He/she should be potentially capable to manage every situation.
Agile Data Science - Data Science Process
In this chapter, we will understand the data science process and terminologies required to understand the process.
“Data science is the blend of data interface, algorithm development and technology in order to solve analytical complex problems”.
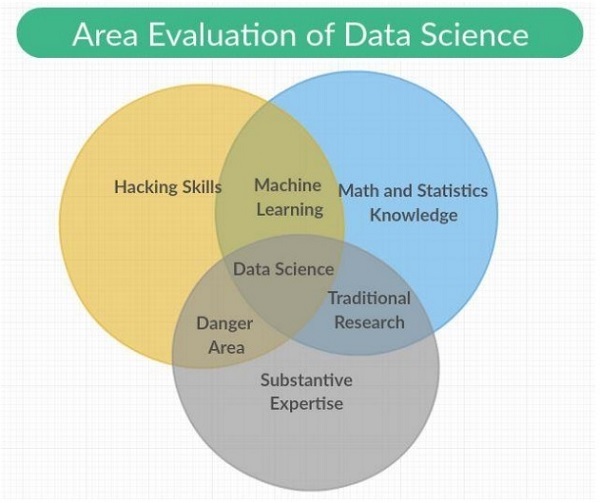
Data science is an interdisciplinary field encompassing scientific methods, processes and systems with categories included in it as Machine learning, math and statistics knowledge with traditional research. It also includes a combination of hacking skills with substantive expertise. Data science draws principles from mathematics, statistics, information science, and computer science, data mining and predictive analysis.
The different roles that form part of the data science team are mentioned below −
Customers
Customers are the people who use the product. Their interest determines the success of project and their feedback is very valuable in data science.
Business Development
This team of data science signs in early customers, either firsthand or through creation of landing pages and promotions. Business development team delivers the value of product.
Product Managers
Product managers take in the importance to create best product, which is valuable in market.
Interaction designers
They focus on design interactions around data models so that users find appropriate value.
Data scientists
Data scientists explore and transform the data in new ways to create and publish new features. These scientists also combine data from diverse sources to create a new value. They play an important role in creating visualizations with researchers, engineers and web developers.
Researchers
As the name specifies researchers are involved in research activities. They solve complicated problems, which data scientists cannot do. These problems involve intense focus and time of machine learning and statistics module.
Adapting to Change
All the team members of data science are required to adapt to new changes and work on the basis of requirements. Several changes should be made for adopting agile methodology with data science, which are mentioned as follows −
Choosing generalists over specialists.
Preference of small teams over large teams.
Using high-level tools and platforms.
Continuous and iterative sharing of intermediate work.
Note
In the Agile data science team, a small team of generalists uses high-level tools that are scalable and refine data through iterations into increasingly higher states of value.
Consider the following examples related to the work of data science team members −
Designers deliver CSS.
Web developers build entire applications, understand the user experience, and interface design.
Data scientists should work on both research and building web services including web applications.
Researchers work in code base, which shows results explaining intermediate results.
Product managers try identifying and understanding the flaws in all the related areas.
Agile Tools and Installation
In this chapter, we will learn about the different Agile tools and their installation. The development stack of agile methodology includes the following set of components −
Events
An event is an occurrence that happens or is logged along with its features and timestamps.
An event can come in many forms like servers, sensors, financial transactions or actions, which our users take in our application. In this complete tutorial, we will use JSON files that will facilitate data exchange among different tools and languages.
Collectors
Collectors are event aggregators. They collect events in a systematic manner to store and aggregate bulky data queuing them for action by real time workers.
Distributed document
These documents include multinode (multiple nodes) which stores document in a specific format. We will focus on MongoDB in this tutorial.
Web application server
Web application server enables data as JSON through client through visualization, with minimal overhead. It means web application server helps to test and deploy the projects created with agile methodology.
Modern Browser
It enables modern browser or application to present data as an interactive tool for our users.
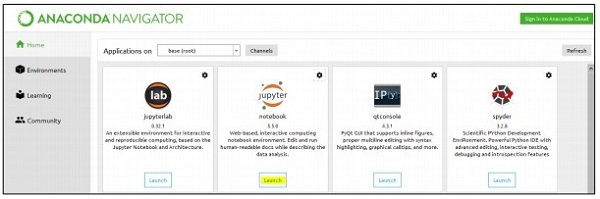
Local Environmental Setup
For managing data sets, we will focus on the Anaconda framework of python that includes tools for managing excel, csv and many more files. The dashboard of Anaconda framework once installed is as shown below. It is also called the “Anaconda Navigator” −
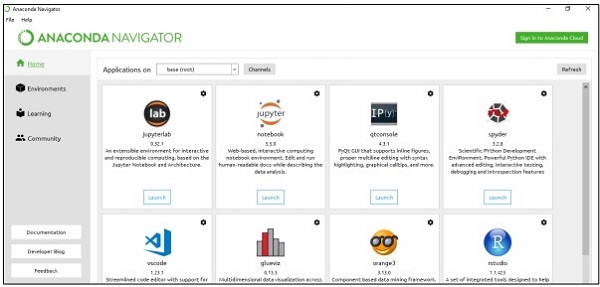
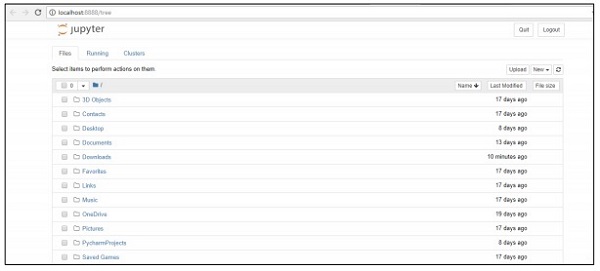
The navigator includes the “Jupyter framework” which is a notebook system that helps to manage datasets. Once you launch the framework, it will be hosted in the browser as mentioned below −
Agile Data Science - Data Processing in Agile
In this chapter, we will focus on the difference between structured, semi-structured and unstructured data.
Structured data
Structured data concerns the data stored in SQL format in table with rows and columns. It includes a relational key, which is mapped into pre-designed fields. Structured data is used on a larger scale.
Structured data represents only 5 to 10 percent of all informatics data.
Semi-structured data
Sem-structured data includes data which do not reside in relational database. They include some of organizational properties that make it easier to analyse. It includes the same process to store them in relational database. The examples of semi-structured database are CSV files, XML and JSON documents. NoSQL databases are considered semistructured.
Unstructured data
Unstructured data represents 80 percent of data. It often includes text and multimedia content. The best examples of unstructured data include audio files, presentations and web pages. The examples of machine generated unstructured data are satellite images, scientific data, photographs and video, radar and sonar data.
The above pyramid structure specifically focusses on the amount of data and the ratio on which it is scattered.
Quasi-structured data appears as type between unstructured and semi-structured data. In this tutorial, we will focus on semi-structured data, which is beneficial for agile methodology and data science research.
Semi structured data does not have a formal data model but has an apparent, selfdescribing pattern and structure which is developed by its analysis.
Agile Data Science - SQL versus NoSQL
The complete focus of this tutorial is to follow agile methodology with less number of steps and with implementation of more useful tools. To understand this, it is important to know the difference between SQL and NoSQL databases.
Most of the users are aware of SQL database, and have a good knowledge on either MySQL, Oracle or other SQL databases. Over the last several years, NoSQL database is getting widely adopted to solve various business problems and requirements of project.
The following table shows the difference between SQL and NoSQL databases −
| SQL | NoSQL |
|---|---|
| SQL databases are mainly called Relational Database Management system (RDBMS). | NoSQL database is also called documentoriented database. It is non-relational and distributed. |
| SQL based databases includes structure of table with rows and columns. Collection of tables and other schema structures called database. | NoSQL database includes documents as major structure and the inclusion of documents is called collection. |
| SQL databases include predefined schema. | NoSQL databases have dynamic data and include unstructured data. |
| SQL databases are vertical scalable. | NoSQL databases are horizontal scalable. |
| SQL databases are good fit for complex query environment. | NoSQL do not have standard interfaces for complex query development. |
| SQL databases are not feasible for hierarchal data storage. | NoSQL databases fits better for hierarchical data storage. |
| SQL databases are best fit for heavy transactions in the specified applications. | NoSQL databases are still not considered comparable in high load for complex transactional applications. |
| SQL databases provides excellent support for their vendors. | NoSQL database still relies on community support. Only few experts are available for setup and deployed for large-scale NoSQL deployments. |
| SQL databases focuses on ACID properties – Atomic, Consistency, Isolation And Durability. | NoSQL database focuses on CAP properties – Consistency, Availability, and Partition tolerance. |
| SQL databases can be classified as open source or closed source based on the vendors who have opted them. | NoSQL databases are classified based on the storage type. NoSQL databases are open source by default. |
Why NoSQL for agile?
The above-mentioned comparison shows that the NoSQL document database completely supports agile development. It is schema-less and does not completely focus on data modelling. Instead, NoSQL defers applications and services and thus developers get a better idea of how data can be modeled. NoSQL defines data model as the application model.
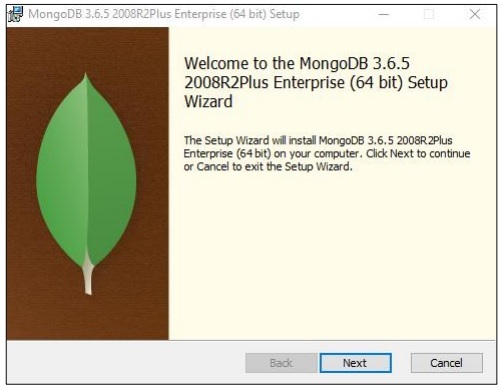
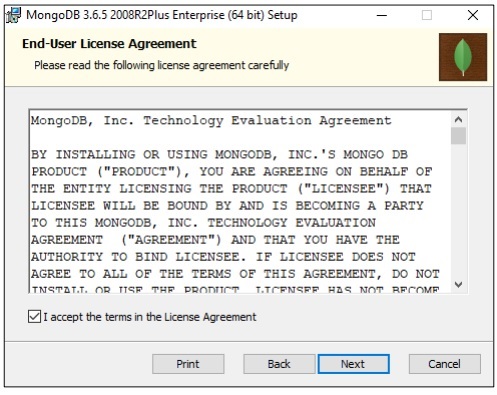
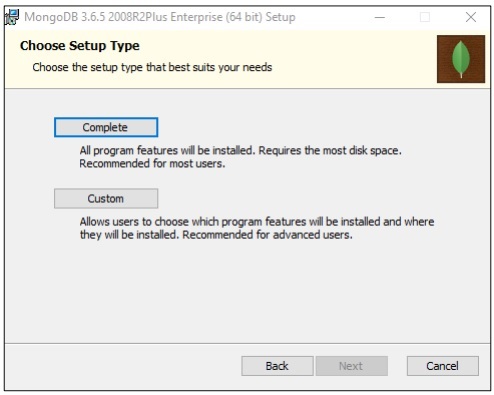
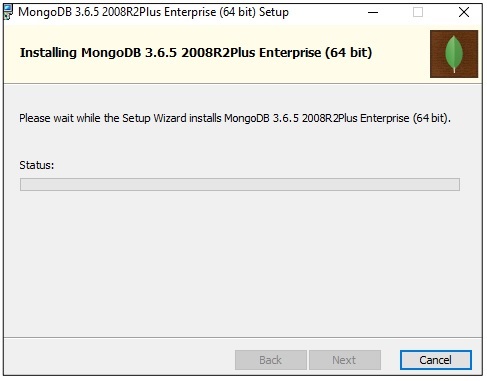
MongoDB Installation
Throughout this tutorial, we will focus more on the examples of MongoDB as it is considered the best “NoSQL schema”.
NoSQL and Dataflow programming
There are times when the data is unavailable in relational format and we need to keep it transactional with the help of NoSQL databases.
In this chapter, we will focus on the dataflow of NoSQL. We will also learn how it is operational with a combination of agile and data science.
One of the major reasons to use NoSQL with agile is to increase the speed with market competition. The following reasons show how NoSQL is a best fit to agile software methodology −
Fewer Barriers
Changing the model, which at present is going through mid-stream has some real costs even in case of agile development. With NoSQL, the users work with aggregate data instead of wasting time in normalizing data. The main point is to get something done and working with the goal of making model perfect data.
Increased Scalability
Whenever an organization is creating product, it lays more focus on its scalability. NoSQL is always known for its scalability but it works better when it is designed with horizontal scalability.
Ability to leverage data
NoSQL is a schema-less data model that allows the user to readily use volumes of data, which includes several parameters of variability and velocity. When considering a choice of technology, you should always consider the one, which leverages the data to a greater scale.
Dataflow of NoSQL
Let us consider the following example wherein, we have shown how a data model is focused on creating the RDBMS schema.
Following are the different requirements of schema −
User Identification should be listed.
Every user should have mandatory at least one skill.
The details of every user’s experience should be maintained properly.
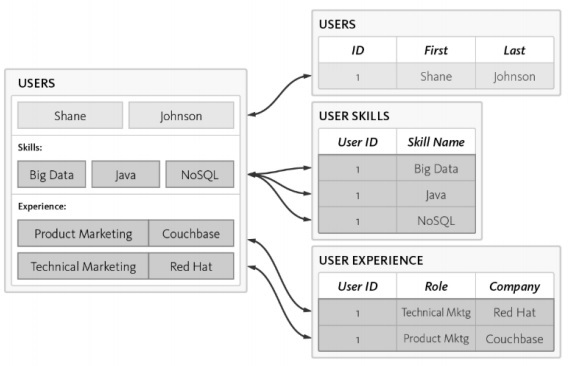
The user table is normalized with 3 separate tables −
Users
User skills
User experience
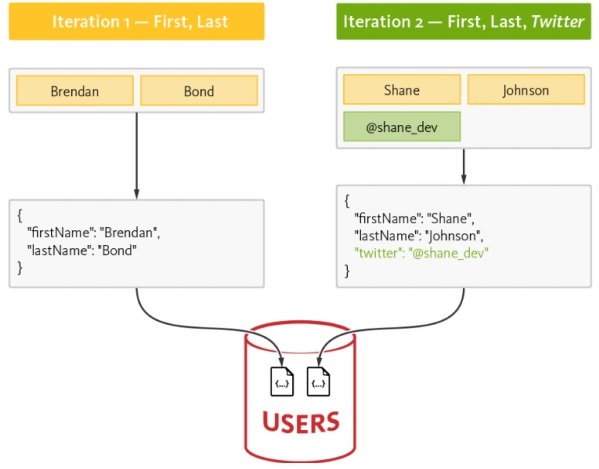
The complexity increases while querying the database and time consumption is noted with increased normalization which is not good for Agile methodology. The same schema can be designed with the NoSQL database as mentioned below −
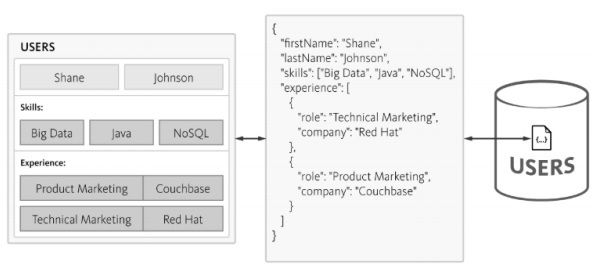
NoSQL maintains the structure in JSON format, which is light- weight in structure. With JSON, applications can store objects with nested data as single documents.
Collecting and Displaying Records
In this chapter, we will focus on the JSON structure, which forms part of the “Agile methodology”. MongoDB is a widely used NoSQL data structure and operates easily for collecting and displaying records.
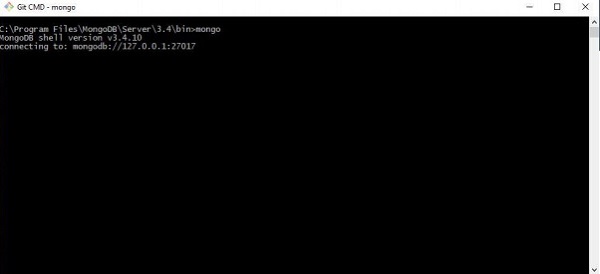
Step 1
This step involves establishing connection with MongoDB for creating collection and specified data model. All you need to execute is “mongod” command for starting connection and mongo command to connect to the specified terminal.
Step 2
Create a new database for creating records in JSON format. For now, we are creating a dummy database named “mydb”.
>use mydb
switched to db mydb
>db
mydb
>show dbs
local 0.78125GB
test 0.23012GB
>db.user.insert({"name":"Agile Data Science"})
>show dbs
local 0.78125GB
mydb 0.23012GB
test 0.23012GB
Step 3
Creating collection is mandatory to get the list of records. This feature is beneficial for data science research and outputs.
>use test
switched to db test
>db.createCollection("mycollection")
{ "ok" : 1 }
>show collections
mycollection
system.indexes
>db.createCollection("mycol", { capped : true, autoIndexId : true, size :
 6142800, max : 10000 } )
{ "ok" : 1 }
>db.agiledatascience.insert({"name" : "demoname"})
>show collections
mycol
mycollection
system.indexes
demoname
Agile Data Science - Data Visualization
Data visualization plays a very important role in data science. We can consider data visualization as a module of data science. Data Science includes more than building predictive models. It includes explanation of models and using them to understand data and make decisions. Data visualization is an integral part of presenting data in the most convincing way.
From the data science point of view, data visualization is a highlighting feature which shows the changes and trends.
Consider the following guidelines for effective data visualization −
Position data along common scale.
Use of bars are more effective in comparison of circles and squares.
Proper color should be used for scatter plots.
Use pie chart to show proportions.
Sunburst visualization is more effective for hierarchical plots.
Agile needs a simple scripting language for data visualization and with data science in collaboration “Python” is the suggested language for data visualization.
Example 1
The following example demonstrates data visualization of GDP calculated in specific years. “Matplotlib” is the best library for data visualization in Python. The installation of this library is shown below −
Consider the following code to understand this −
import matplotlib.pyplot as plt
years = [1950, 1960, 1970, 1980, 1990, 2000, 2010]
gdp = [300.2, 543.3, 1075.9, 2862.5, 5979.6, 10289.7, 14958.3]

# create a line chart, years on x-axis, gdp on y-axis
plt.plot(years, gdp, color='green', marker='o', linestyle='solid')

# add a title plt.title("Nominal GDP")
# add a label to the y-axis
plt.ylabel("Billions of $")
plt.show()
Output
The above code generates the following output −
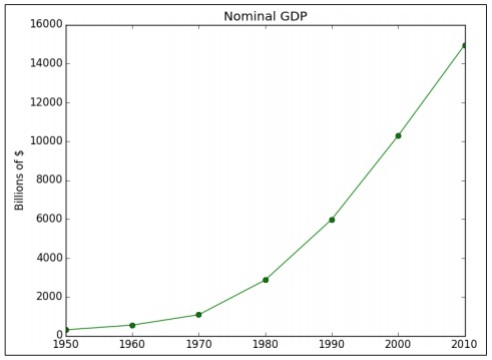
There are many ways to customize the charts with axis labels, line styles and point markers. Let’s focus on the next example which demonstrates the better data visualization. These results can be used for better output.
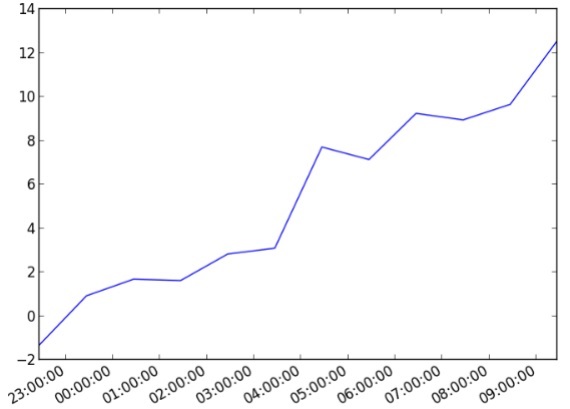
Example 2
import datetime
import random
import matplotlib.pyplot as plt

# make up some data
x = [datetime.datetime.now() + datetime.timedelta(hours=i) for i in range(12)]
y = [i+random.gauss(0,1) for i,_ in enumerate(x)]

# plot
plt.plot(x,y)

# beautify the x-labels
plt.gcf().autofmt_xdate()
plt.show()
Output
The above code generates the following output −
Agile Data Science - Data Enrichment
Data enrichment refers to a range of processes used to enhance, refine and improve raw data. It refers to useful data transformation (raw data to useful information). The process of data enrichment focusses on making data a valuable data asset for modern business or enterprise.
The most common data enrichment process includes correction of spelling mistakes or typographical errors in database through use of specific decision algorithms. Data enrichment tools add useful information to simple data tables.
Consider the following code for spell correction of words −
import re
from collections import Counter
def words(text): return re.findall(r'\w+', text.lower())
WORDS = Counter(words(open('big.txt').read()))

def P(word, N=sum(WORDS.values())):
   "Probabilities of words"
   return WORDS[word] / N

def correction(word):
   "Spelling correction of word"
   return max(candidates(word), key=P)

def candidates(word):
   "Generate possible spelling corrections for word."
   return (known([word]) or known(edits1(word)) or known(edits2(word)) or [word])

def known(words):
   "The subset of `words` that appear in the dictionary of WORDS."
   return set(w for w in words if w in WORDS)

def edits1(word):
   "All edits that are one edit away from `word`."
   letters = 'abcdefghijklmnopqrstuvwxyz'
   splits = [(word[:i], word[i:]) for i in range(len(word) + 1)]
   deletes = [L + R[1:] for L, R in splits if R]
   transposes = [L + R[1] + R[0] + R[2:] for L, R in splits if len(R)>1]
   replaces = [L + c + R[1:] for L, R in splits if R for c in letters]
   inserts = [L + c + R for L, R in splits for c in letters]
   return set(deletes + transposes + replaces + inserts)

def edits2(word):
   "All edits that are two edits away from `word`."
   return (e2 for e1 in edits1(word) for e2 in edits1(e1))
   print(correction('speling'))
   print(correction('korrectud'))
In this program, we will match with “big.txt” which includes corrected words. Words match with words included in text file and print the appropriate results accordingly.
Output
The above code will generate the following output −
Agile Data Science - Working with Reports
In this chapter, we will learn about report creation, which is an important module of agile methodology. Agile sprints chart pages created by visualization into full-blown reports. With reports, charts become interactive, static pages become dynamic and network related data. The characteristics of reports stage of the data value pyramid is shown below −
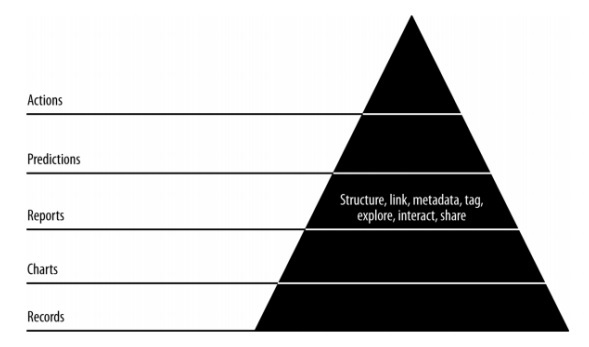
We will lay more stress on creating csv file, which can be used as report for data science analysis, and drawing conclusion. Although agile focusses on less documentation, generating reports to mention the progress of product development is always considered.
import csv
#----------------------------------------------------------------------
def csv_writer(data, path):
   """
      Write data to a CSV file path
   """
   with open(path, "wb") as csv_file:
   writer = csv.writer(csv_file, delimiter=',')
   for line in data:
   writer.writerow(line)
#----------------------------------------------------------------------
if __name__ == "__main__":
   data = ["first_name,last_name,city".split(","),
      "Tyrese,Hirthe,Strackeport".split(","),
      "Jules,Dicki,Lake Nickolasville".split(","),
      "Dedric,Medhurst,Stiedemannberg".split(",")
   ]

   path = "output.csv"
   csv_writer(data, path)
The above code will help you generate the “csv file” as shown below −
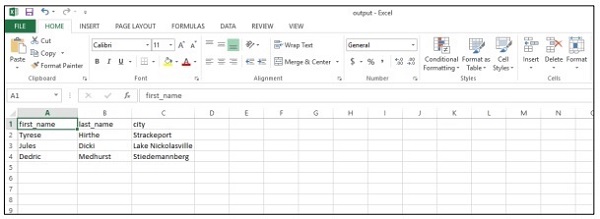
Let us consider the following benefits of csv (comma- separated values) reports −
- It is human friendly and easy to edit manually.
- It is simple to implement and parse.
- CSV can be processed in all applications.
- It is smaller and faster to handle.
- CSV follows a standard format.
- It provides straightforward schema for data scientists.
Agile Data Science - Role of Predictions
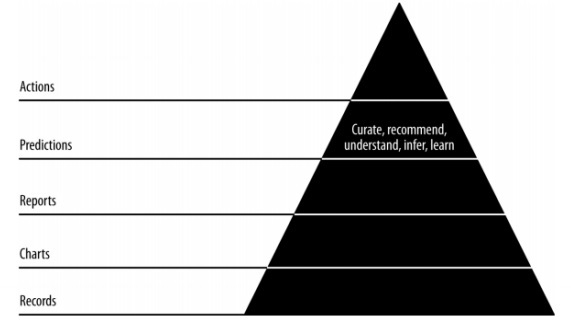
In this chapter, we will earn about the role of predictions in agile data science. The interactive reports expose different aspects of data. Predictions form the fourth layer of agile sprint.
When making predictions, we always refer to the past data and use them as inferences for future iterations. In this complete process, we transition data from batch processing of historical data to real-time data about the future.
The role of predictions includes the following −
Predictions help in forecasting. Some forecasts are based on statistical inference. Some of the predictions are based on opinions of pundits.
Statistical inference are involved with predictions of all kinds.
Sometimes forecasts are accurate, while sometimes forecasts are inaccurate.
Predictive Analytics
Predictive analytics includes a variety of statistical techniques from predictive modeling, machine learning and data mining which analyze current and historical facts to make predictions about future and unknown events.
Predictive analytics requires training data. Trained data includes independent and dependent features. Dependent features are the values a user is trying to predict. Independent features are features describing the things we want to predict based on dependent features.
The study of features is called feature engineering; this is crucial to making predictions. Data visualization and exploratory data analysis are parts of feature engineering; these form the core of Agile data science.
Making Predictions
There are two ways of making predictions in agile data science −
Regression
Classification
Building a regression or a classification completely depends on business requirements and its analysis. Prediction of continuous variable leads to regression model and prediction of categorical variables leads to classification model.
Regression
Regression considers examples that comprise features and thereby, produces a numeric output.
Classification
Classification takes the input and produces a categorical classification.
Note − The example dataset that defines input to statistical prediction and that enables the machine to learn is called “training data”.
Extracting features with PySpark
In this chapter, we will learn about the application of the extracting features with PySpark in Agile Data Science.
Overview of Spark
Apache Spark can be defined as a fast real-time processing framework. It does computations to analyze data in real time. Apache Spark is introduced as stream processing system in real-time and can also take care of batch processing. Apache Spark supports interactive queries and iterative algorithms.
Spark is written in “Scala programming language”.
PySpark can be considered as a combination of Python with Spark. PySpark offers PySpark shell, which links Python API to the Spark core and initializes the Spark context. Most of the data scientists use PySpark for tracking features as discussed in the previous chapter.
In this example, we will focus on the transformations to build a dataset called counts and save it to a particular file.
text_file = sc.textFile("hdfs://...")
counts = text_file.flatMap(lambda line: line.split(" ")) \
   .map(lambda word: (word, 1)) \
   .reduceByKey(lambda a, b: a + b)
counts.saveAsTextFile("hdfs://...")
Using PySpark, a user can work with RDDs in python programming language. The inbuilt library, which covers the basics of Data Driven documents and components, helps in this.
Building a Regression Model
Logistic Regression refers to the machine learning algorithm that is used to predict the probability of categorical dependent variable. In logistic regression, the dependent variable is binary variable, which consists of data coded as 1 (Boolean values of true and false).
In this chapter, we will focus on developing a regression model in Python using continuous variable. The example for linear regression model will focus on data exploration from CSV file.
The classification goal is to predict whether the client will subscribe (1/0) to a term deposit.
import pandas as pd
import numpy as np
from sklearn import preprocessing
import matplotlib.pyplot as plt
plt.rc("font", size=14)
from sklearn.linear_model import LogisticRegression
from sklearn.cross_validation import train_test_split
import seaborn as sns
sns.set(style="white")
sns.set(style="whitegrid", color_codes=True)
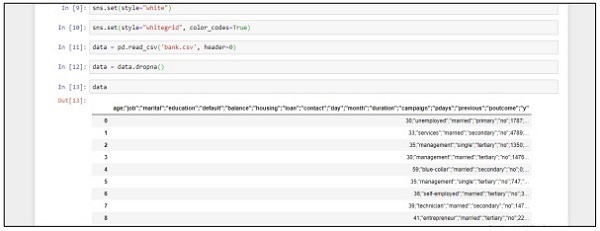
data = pd.read_csv('bank.csv', header=0)
data = data.dropna()
print(data.shape)
print(list(data.columns))
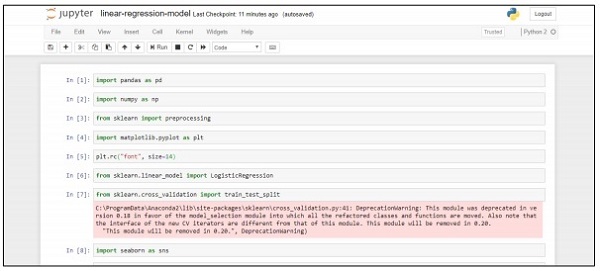
Follow these steps to implement the above code in Anaconda Navigator with “Jupyter Notebook” −
Step 1 − Launch the Jupyter Notebook with Anaconda Navigator.
Step 2 − Upload the csv file to get the output of regression model in systematic manner.
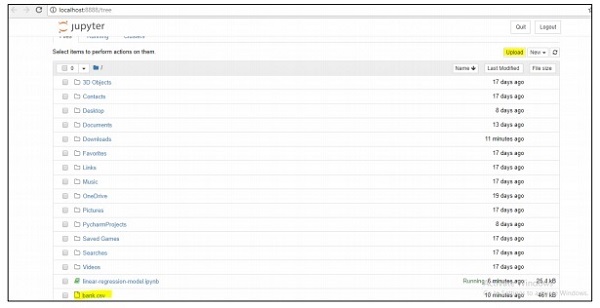
Step 3 − Create a new file and execute the above-mentioned code line to get the desired output.
Deploying a predictive system
In this example, we will learn how to create and deploy predictive model which helps in the prediction of house prices using python script. The important framework used for deployment of predictive system includes Anaconda and “Jupyter Notebook”.
Follow these steps to deploy a predictive system −
Step 1 − Implement the following code to convert values from csv files to associated values.
import numpy as np
import pandas as pd
import matplotlib.pyplot as plt
import seaborn as sns
import mpl_toolkits
%matplotlib inline
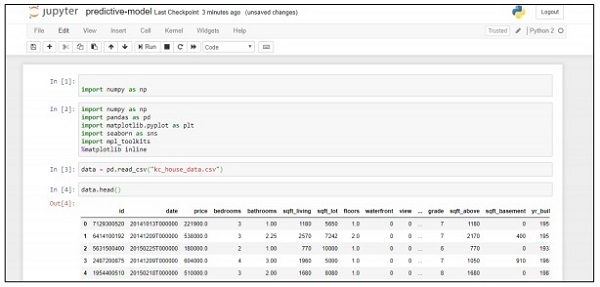
data = pd.read_csv("kc_house_data.csv")
data.head()
The above code generates the following output −
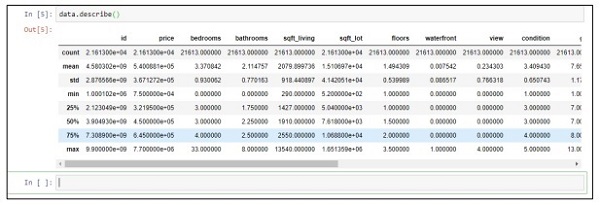
Step 2 − Execute the describe function to get the data types included in attributed of csv files.
data.describe()
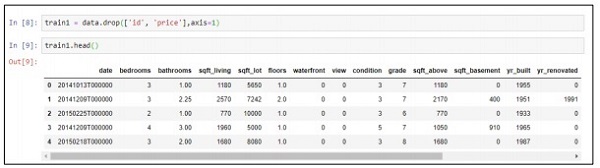
Step 3 − We can drop the associated values based on the deployment of the predictive model that we created.
train1 = data.drop(['id', 'price'],axis=1)
train1.head()
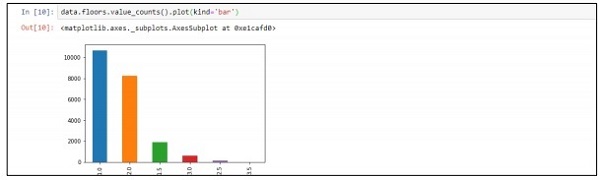
Step 4 − You can visualize the data as per the records. The data can be used for data science analysis and output of white papers.
data.floors.value_counts().plot(kind='bar')
Agile Data Science - SparkML
Machine learning library also called the “SparkML” or “MLLib” consists of common learning algorithms, including classification, regression, clustering and collaborative filtering.
Why learn SparkML for Agile?
Spark is becoming the de-facto platform for building machine learning algorithms and applications. The developers work on Spark for implementing machine algorithms in a scalable and concise manner in the Spark framework. We will learn the concepts of Machine learning, its utilities and algorithms with this framework. Agile always opts for a framework, which delivers short and quick results.
ML Algorithms
ML Algorithms include common learning algorithms such as classification, regression, clustering and collaborative filtering.
Features
It includes feature extraction, transformation, dimension reduction and selection.
Pipelines
Pipelines provide tools for constructing, evaluating and tuning machine-learning pipelines.
Popular Algorithms
Following are a few popular algorithms −
Basic Statistics
Regression
Classification
Recommendation System
Clustering
Dimensionality Reduction
Feature Extraction
Optimization
Recommendation System
A recommendation system is a subclass of information filtering system that seeks prediction of “rating” and “preference” that a user suggests to a given item.
Recommendation system includes various filtering systems, which are used as follows −
Collaborative Filtering
It includes building a model based on the past behavior as well as similar decisions made by other users. This specific filtering model is used to predict items that a user is interested to take in.
Content based Filtering
It includes the filtering of discrete characteristics of an item in order to recommend and add new items with similar properties.
In our subsequent chapters, we will focus on the use of recommendation system for solving a specific problem and improving the prediction performance from the agile methodology point of view.
Fixing Prediction Problem
In this chapter, we will focus on fixing a prediction problem with the help of a specific scenario.
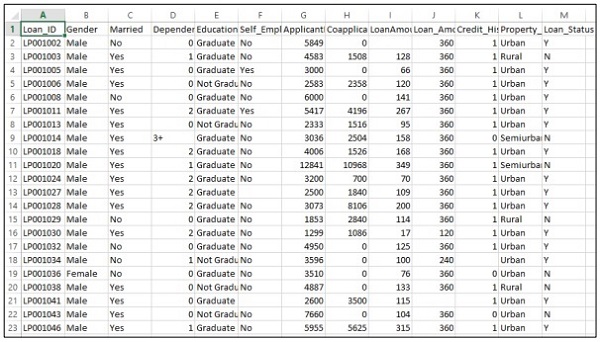
Consider that a company wants to automate the loan eligibility details as per the customer details provided through online application form. The details include name of customer, gender, marital status, loan amount and other mandatory details.
The details are recorded in the CSV file as shown below −
Execute the following code to evaluate the prediction problem −
import pandas as pd
from sklearn import ensemble
import numpy as np

from scipy.stats import mode
from sklearn import preprocessing,model_selection
from sklearn.linear_model import LogisticRegression
from sklearn.preprocessing import LabelEncoder

#loading the dataset
data=pd.read_csv('train.csv',index_col='Loan_ID')
def num_missing(x):
   return sum(x.isnull())

#imputing the the missing values from the data
data['Gender'].fillna(mode(list(data['Gender'])).mode[0], inplace=True)
data['Married'].fillna(mode(list(data['Married'])).mode[0], inplace=True)
data['Self_Employed'].fillna(mode(list(data['Self_Employed'])).mode[0], inplace=True)

# print (data.apply(num_missing, axis=0))
# #imputing mean for the missing value
data['LoanAmount'].fillna(data['LoanAmount'].mean(), inplace=True)
mapping={'0':0,'1':1,'2':2,'3+':3}
data = data.replace({'Dependents':mapping})
data['Dependents'].fillna(data['Dependents'].mean(), inplace=True)
data['Loan_Amount_Term'].fillna(method='ffill',inplace=True)
data['Credit_History'].fillna(method='ffill',inplace=True)
print (data.apply(num_missing,axis=0))

#converting the cateogorical data to numbers using the label encoder
var_mod = ['Gender','Married','Education','Self_Employed','Property_Area','Loan_Status']
le = LabelEncoder()
for i in var_mod:
   le.fit(list(data[i].values))
   data[i] = le.transform(list(data[i]))

#Train test split
x=['Gender','Married','Education','Self_Employed','Property_Area','LoanAmount', 'Loan_Amount_Term','Credit_History','Dependents']
y=['Loan_Status']
print(data[x])
X_train,X_test,y_train,y_test=model_selection.train_test_split(data[x],data[y], test_size=0.2)

#
# #Random forest classifier
# clf=ensemble.RandomForestClassifier(n_estimators=100,
criterion='gini',max_depth=3,max_features='auto',n_jobs=-1)
clf=ensemble.RandomForestClassifier(n_estimators=200,max_features=3,min_samples
   _split=5,oob_score=True,n_jobs=-1,criterion='entropy')

clf.fit(X_train,y_train)
accuracy=clf.score(X_test,y_test)
print(accuracy)
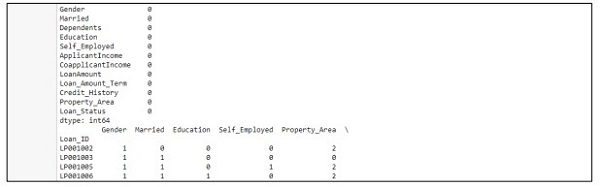
Output
The above code generates the following output.
Improving Prediction Performance
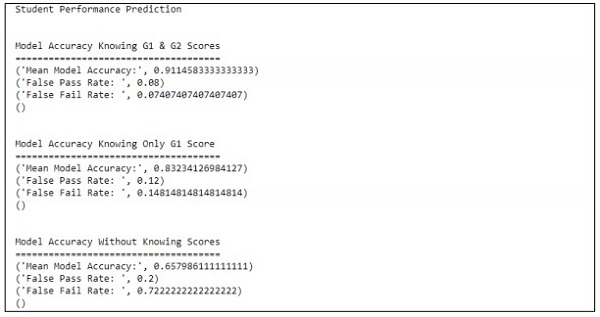
In this chapter, we will focus on building a model that helps in the prediction of student’s performance with a number of attributes included in it. The focus is to display the failure result of students in an examination.
Process
The target value of assessment is G3. This values can be binned and further classified as failure and success. If G3 value is greater than or equal to 10, then the student passes the examination.
Example
Consider the following example wherein a code is executed to predict the performance if students −
import pandas as pd
""" Read data file as DataFrame """
df = pd.read_csv("student-mat.csv", sep=";")
""" Import ML helpers """
from sklearn.preprocessing import LabelEncoder
from sklearn.model_selection import train_test_split
from sklearn.metrics import confusion_matrix
from sklearn.model_selection import GridSearchCV, cross_val_score
from sklearn.pipeline import Pipeline
from sklearn.feature_selection import SelectKBest, chi2
from sklearn.svm import LinearSVC # Support Vector Machine Classifier model
""" Split Data into Training and Testing Sets """
def split_data(X, Y):
 return train_test_split(X, Y, test_size=0.2, random_state=17)
""" Confusion Matrix """
def confuse(y_true, y_pred):
 cm = confusion_matrix(y_true=y_true, y_pred=y_pred)
 # print("\nConfusion Matrix: \n", cm)
  fpr(cm)
 ffr(cm)
""" False Pass Rate """
def fpr(confusion_matrix):
 fp = confusion_matrix[0][1]
 tf = confusion_matrix[0][0]
 rate = float(fp) / (fp + tf)
 print("False Pass Rate: ", rate)
""" False Fail Rate """
def ffr(confusion_matrix):
 ff = confusion_matrix[1][0]
 tp = confusion_matrix[1][1]
 rate = float(ff) / (ff + tp)
 print("False Fail Rate: ", rate)
 return rate
""" Train Model and Print Score """
def train_and_score(X, y):
 X_train, X_test, y_train, y_test = split_data(X, y)
 clf = Pipeline([
 ('reduce_dim', SelectKBest(chi2, k=2)),
 ('train', LinearSVC(C=100))
 ])
 scores = cross_val_score(clf, X_train, y_train, cv=5, n_jobs=2)
 print("Mean Model Accuracy:", np.array(scores).mean())
 clf.fit(X_train, y_train)
 confuse(y_test, clf.predict(X_test))
 print()
""" Main Program """
def main():
 print("\nStudent Performance Prediction")
 # For each feature, encode to categorical values
 class_le = LabelEncoder()
 for column in df[["school", "sex", "address", "famsize", "Pstatus", "Mjob",
"Fjob", "reason", "guardian", "schoolsup", "famsup", "paid", "activities",
"nursery", "higher", "internet", "romantic"]].columns:
 df[column] = class_le.fit_transform(df[column].values)
 # Encode G1, G2, G3 as pass or fail binary values
 for i, row in df.iterrows():
 if row["G1"] >= 10:
 df["G1"][i] = 1
 else:
 df["G1"][i] = 0
 if row["G2"] >= 10:
 df["G2"][i] = 1
 else:
 df["G2"][i] = 0
 if row["G3"] >= 10:
 df["G3"][i] = 1
 else:
 df["G3"][i] = 0
 # Target values are G3
 y = df.pop("G3")
 # Feature set is remaining features
 X = df
 print("\n\nModel Accuracy Knowing G1 & G2 Scores")
 print("=====================================")
 train_and_score(X, y)
 # Remove grade report 2
 X.drop(["G2"], axis = 1, inplace=True)
 print("\n\nModel Accuracy Knowing Only G1 Score")
 print("=====================================")
 train_and_score(X, y)
 # Remove grade report 1
 X.drop(["G1"], axis=1, inplace=True)
 print("\n\nModel Accuracy Without Knowing Scores")
 print("=====================================")
 train_and_score(X, y)
main()
Output
The above code generates the output as shown below
The prediction is treated with reference to only one variable. With reference to one variable, the student performance prediction is as shown below −
Creating better scene with agile and data science
Agile methodology helps organizations to adapt change, compete in the market and build high quality products. It is observed that organizations mature with agile methodology, with increasing change in requirements from clients. Compiling and synchronizing data with agile teams of organization is significant in rolling up data across as per the required portfolio.
Build a better plan
The standardized agile performance solely depends on the plan. The ordered data-schema empowers productivity, quality and responsiveness of the organization’s progress. The level of data consistency is maintained with historical and real time scenarios.
Consider the following diagram to understand the data science experiment cycle −
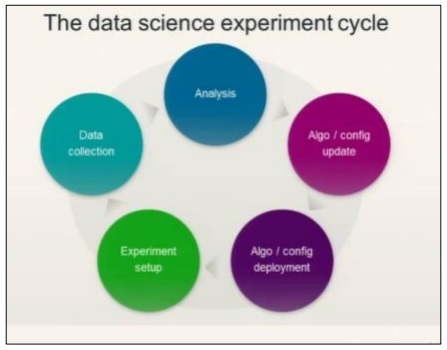
Data science involves the analysis of requirements followed by the creation of algorithms based on the same. Once the algorithms are designed along with the environmental setup, a user can create experiments and collect data for better analysis.
This ideology computes the last sprint of agile, which is called “actions”.
Actions involves all the mandatory tasks for the last sprint or level of agile methodology. The track of data science phases (with respect to life cycle) can be maintained with story cards as action items.
Predictive Analysis and Big data
The future of planning completely lies in the customization of data reports with the data collected from analysis. It will also include manipulation with big data analysis. With the help of big data, discrete pieces of information can be analyzed, effectively with slicing and dicing the metrics of the organization. Analysis is always considered as a better solution.
Agile Data Science - Implementation of Agile
There are various methodologies used in the agile development process. These methodologies can be used for data science research process as well.
The flowchart given below shows the different methodologies −
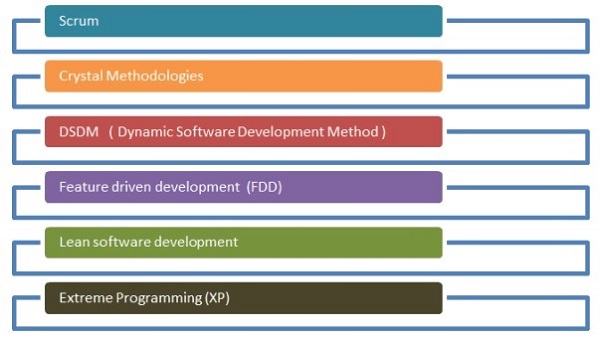
Scrum
In software development terms, scrum means managing work with a small team and management of a specific project to reveal the strength and weaknesses of the project.
Crystal methodologies
Crystal methodologies include innovative techniques for product management and execution. With this method, teams can go about similar tasks in different ways. Crystal family is one of the easiest methodology to apply.
Dynamic Software Development Method
This delivery framework is primarily used to implement the current knowledge system in software methodology.
Future driven development
The focus of this development life cycle is features involved in project. It works best for domain object modeling, code and feature development for ownership.
Lean Software development
This method aims at increasing the speed of software development at low cost and focusses the team on delivering specific value to customer.Extreme Programming
Extreme programming is a unique software development methodology, which focusses on improving the software quality. This comes effective when the customer is not sure about the functionality of any project.
Agile methodologies are taking root in data science stream and it is considered as the important software methodology. With agile self-organizing, cross-functional teams can work together in effective manner. As mentioned there are six main categories of agile development and each one of them can be streamed with data science as per the requirements. Data science involves an iterative process for statistical insights. Agile helps in breaking down the data science modules and helps in processing iterations and sprints in effective manner.
The process of Agile Data Science is an amazing way of understanding how and why data science module is implemented. It solves problems in creative manner.