- Advanced Excel Tutorial
- Advanced Excel - Home
- Excel New Features
- Excel - Chart Recommendations
- Advanced Excel - Format Charts
- Advanced Excel - Chart Design
- Advanced Excel - Richer Data Labels
- Advanced Excel - Leader Lines
- Advanced Excel - New Functions
- Fundamental Data Analysis
- Excel - Instant Data Analysis
- Excel - Sorting Data by Color
- Advanced Excel - Slicers
- Advanced Excel - Flash Fill
- Powerful Data Analysis
- Excel - PivotTable Recommendations
- Powerful Data Analysis – 1
- Advanced Excel - Data Model
- Advanced Excel - Power Pivot
- Excel - External Data Connection
- Advanced Excel - Pivot Table Tools
- Powerful Data Analysis – 2
- Advanced Excel - Power View
- Advanced Excel - Visualizations
- Advanced Excel - Pie Charts
- Advanced Excel - Additional Features
- Advanced Excel - Power View Services
- Advanced Excel - Format Reports
- Advanced Excel - Handling Integers
- Other Features
- Advanced Excel - Templates
- Advanced Excel - Inquire
- Advanced Excel - Workbook Analysis
- Advanced Excel - Manage Passwords
- Advanced Excel - File Formats
- Excel - Discontinued Features
- Advanced Excel Useful Resources
- Advanced Excel - Quick Guide
- Advanced Excel - Useful Resources
- Advanced Excel - Discussion
Advanced Excel - Handling Integers
In Power View, to convert a table to a chart, at least one data column needs to be aggregated. In Excel 2013, Power View aggregates both decimal numbers and integers by default. A Data Model designer can still specify other default behavior, but that is the default.
In Power View, in the Power View Fields, some number fields will have a Sigma Σ symbol next to them. They are aggregates, meaning they will be summed or averaged.
Step 1 − Click on Stacked Bar Chart.
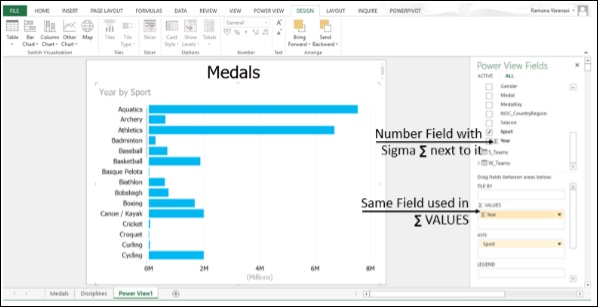
Power View has taken the Year as aggregate, as that is the only numeric field in the selected fields.
Step 2 − Click on the drop-down arrow next to a text (non-numeric) field in the Power View Fields.
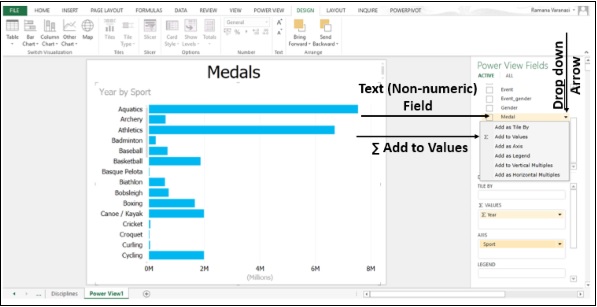
Step 3 − Drag that field to Σ VALUES box.
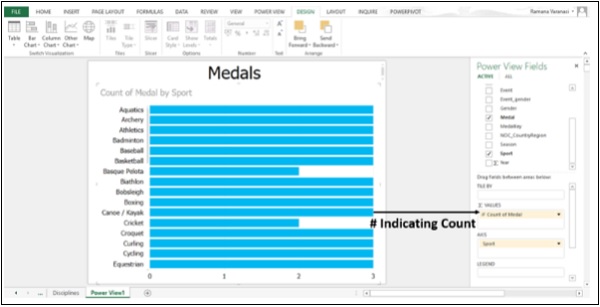
Power View has taken it as Count of the Values of the Field.
Power Query
Power Query is a data discovery and query tool in Excel 2013. You can use Power Query to
Import data from external data sources, including big data sources like Hadoop and Facebook, shaping the data before you bring it into Excel and bringing in only the data you need.
Search for public data from sources such as Wikipedia.
Merge data from a variety of data sources, or append tables together, such as data from several shared tables in SQL Azure.
Bring the result into Excel as a single table for −
- Visualizing in Power Map and Power View.
- Further analysis and modeling in Power Pivot.
Share queries to the Power BI data catalogue so others can use it as a starting point for their data exploration.
“Unpivot” source data from a PivotTable or matrix format to a flat table.
To summarize, the Power Query Data Sources are −
Web page, Excel or CSV file, XML file, Text file, Folder, SQL Server database, Microsoft Azure, SQL Database, Access database, Oracle database, IBM DB2 database, MySQL database, PostgreSQL Database, Sybase Database, Teradata Database, SharePoint List, OData feed, Microsoft Azure Marketplace, Hadoop File (HDFS), Microsoft Azure HDInsight, Microsoft Azure Table Storage, Active Directory, Microsoft Exchange and Facebook.
Power BI Desktop
Power BI is a collection of online services and features that enables you to find and visualize data, share discoveries, and collaborate in intuitive new ways. Power BI extends to all your mobile devices, too.
Power BI introduces the Power BI Desktop, a dedicated report-authoring tool that enables you to transform data, create powerful reports and visualizations, and easily publish to the Power BI service.
Power BI Desktop lets you create a collection of queries, data connections, and reports that can easily be shared with others. Power BI Desktop integrates proven Microsoft technologies – the powerful Query engine, data modeling, and visualizations – and works seamlessly with the online Power BI service.
With the combination of Power BI Desktop (where analysts and others can create powerful data connections, models and reports) and the Power BI service (where Power BI Desktop reports can be shared so the users can view and interact with them), new insights from the world of data are easier to model, build, share, and extend.
Data analysts will find Power BI Desktop a powerful, flexible, and a highly accessible tool to connect with and shape the world of data, build robust models, and create wellstructured reports.
You can perform the following tasks in Power BI −
- Connect to Data
- Shape Data
- Combine Data
- Build Reports
- Share Your Work
Connect to Data
You can contact various web resources and find the ever-growing data in the world. You can Connect to the Data Source so that you can retrieve the Data you want and Adjust the data to meet your needs. The process of adjusting the connected data is called shaping the data.
Shape Data
As you Shape the Data, a Query Editor follows your instructions to adjust the data while loading. The original data source is not affected; only this particular view of the data is shaped.
Steps to Shape Data may include −
- Rename a Table
- Rename a Column
- Transform a Data Type
- Delete Column
- Change text to numbers
- Remove Rows
- Setting the First Row as Headers
Combine Data
If the tables are a result of the queries you applied to the data, they are often referred to as queries. You can combine two tables, or queries, into one.
There are two primary ways of combining queries – merging and appending.
When you have one or more columns to add to another query, you merge the queries. When you have additional rows of data to add to an existing query, you append the query.
If you have enough Data to create interesting Reports, save the Data as Power BI Desktop (.pbix) file. You can Load this data file whenever you want and you can make changes and Reload.
Build Reports
You can build Reports in Power BI Desktop Report view.
The Report view has five main areas −
The ribbon, which displays common tasks associated with reports and visualizations.
The Report view, or canvas, where visualizations are created and arranged.
The Pages tab area along the bottom, which lets you select or add a report page.
The Visualizations pane, where you can change visualizations, customize colors or axes, apply filters, drag fields, and more.
The Fields pane, where query elements and filters can be dragged onto the Report view, or dragged to the Filters area of the Visualizations pane.
You can create different types of interesting reports and visualizations.
Share Your Work
You can share a completed Power BI Desktop report with the others on the Power BI service. There are a few ways to share your work in Power BI Desktop. You can
publish to the Power BI service
upload the .pbix file directly from the Power BI service
save the .pbix file and send it like any other file