- Add and Subtract Whole Numbers
- Home
- Single Digit Addition
- Addition of 3 or More Single Digit Nnumbers
- Addition of Two 2-digit Numbers Without Carry
- Adding 2-digit Numbers and Single Digit Numbers
- Addition of Two 2-digit Numbers With Carry
- Addition With Carry to the Hundreds Place
- Addition of 2-digit, 3-digit and 4-digit Numbers
- Subtracting a Number From a 2-digit Number
- Subtraction of Two 2-digit Numbers Without Borrowing
- Subtraction of Two 2-digit Numbers With Borrowing
- Subtraction with Multiple Regrouping Steps
- Subtraction and Regrouping With Zeros
- Fact Families for Addition and Subtraction
- Addition or Subtraction of Whole Numbers (Word problems)
- Increasing or Decreasing Pattern from a Table of Values
Increasing or Decreasing Pattern from a Table of Values
Consider a table of values; represented by an independent variable (x) and a dependent variable (y). We often use a table of values to display the values we record. Using the table, we can find the relationship between the two variables and write it as a rule. There may be an increasing or decreasing pattern in the relationship between the two variables.
Example
Consider that the total cost (y) of x items is two times the no of items, i.e., y =2 x. The total cost (y) increases as the number of items (x) increase. So it is clear that there is an increasing pattern here in the values of the variables.
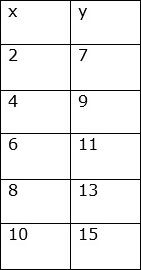
Consider the values of the variables in the table given below.
Solution
Step 1:
Consider pairs of consecutive x values and find the difference.
4 – 2 = 6 – 4 = 8 – 6 = 10 – 8 = 2
Step 2:
Similarly consider pairs of consecutive y values and see the difference.
9 – 7 = 11 – 9 = 13 – 11 = 15 – 13 = 2
Step 3:
We find that for 2-unit increase in x, there is a 2-unit increase in the y value. So we see an increasing pattern in this table of values.
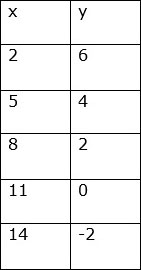
Consider the values of the variables in the table given below.
Solution
Step 1:
Consider pairs of consecutive x values and find the difference.
5 – 2 = 8 – 5 = 11 – 8 = 14 – 11= 3
Step 2:
Similarly consider pairs of consecutive y values and see the difference.
4 – 6 = 2 – 4 = 0 – 2 = -2 – 0 = - 2
Step 3:
We find that for 3-unit increase in x, there is a 2-unit decrease in the y value. So we see a decreasing pattern in this table of values.