- A/B Testing Tutorial
- A/B Testing - Home
- A/B Testing - Overview
- A/B Testing - How it Works
- A/B Testing - Why to Use?
- A/B Testing - What to Test?
- A/B Testing - Process
- A/B Testing - Collect Data
- A/B Testing - Identify Goals
- A/B Testing - Create Variations
- A/B Testing - Run Experiment
- A/B Testing - Analyze Results
- A/B Testing - Tools
- A/B Testing - Multivariate
- A/B Testing - SEO
- A/B Testing - Interview Questions
- A/B Testing Useful Resources
- A/B Testing - Quick Guide
- A/B Testing - Useful Resources
- A/B Testing - Discussion
A/B Testing - Quick Guide
A/B Testing – Overview
A/B Testing (also known as Split testing) defines a way to compare two versions of an application or a web page that enables you to determine which one performs better. It is one of the easiest ways to analyze an application or a web page to create a new version. Thereafter, both these versions can be compared to find the conversion rate, which further helps in finding the better performer of these two.
Example
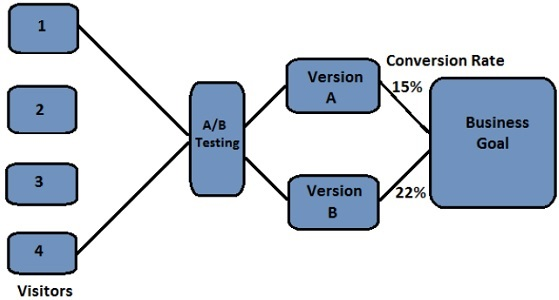
Let us assume that there is a web page and all the traffic is directed to this page. Now as a part of A/B Testing, you have made some minor changes like headlines, numbering, etc. on the same page and half of its traffic is directed to the modified version of this web page. Now you have version A and version B of the same web page and you can monitor the visitor’s actions using statistics and analysis to determine the version that yields a higher conversion rate.
A conversion rate is defined as the instance, when any visitor on your website performs a desired action. A/B Testing enables you to determine the best online marketing strategy for your business. Take a look at the following illustration. It shows that version A yields a conversion rate of 15% and version B yields a conversion rate of 22%.
A/B Testing - How it Works
You can monitor the visitor’s actions using statistics and analysis to determine the version that yields a higher conversion rate. A/B Testing results are usually given in fancy mathematical and statistical terms, but the meaning behind the numbers are actually quite simple. There are two significant methods through which you can check conversion rates using A/B Testing −
- Sampling of Data
- Confidence Intervals
Let us discuss these two methods in detail.
Sampling of Data
The number of samples depend on the number of tests performed. The count of conversion rate is called a sample and the process of collecting these samples is called as sampling.
Example
Let us say you have two products A and B, you want to collect sample data as per its demand in the market. You can ask a few people to choose from product A and B and then request them to participate in a survey. As the number of participant’s increase, it will start showing a realistic conversion rate.
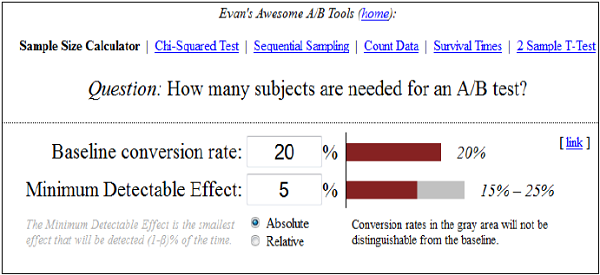
There are various tools that can be used to determine the correct number of sample size. One such free tool available is −
Confidence Intervals in A/B Testing
Confidence interval is the measurement of deviation from the average on the multiple number of samples. Let us assume that 22% of people prefer product A in the above example, with ±2% of confidence interval. This interval indicates the upper and lower limit of the people, who opt for Product A and is also called as margin of error. For best results in this average survey, the margin of error should be as small as possible.
Example
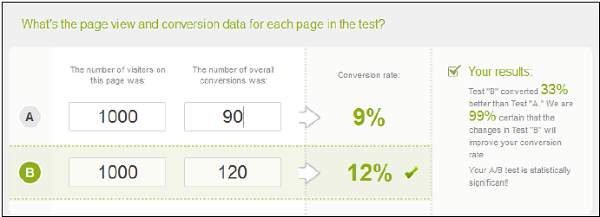
Let us assume that in Product B, we have added a minor change and then performed A/B Testing on these two products. Confidence interval product A and B are 10% with ±1% and 20% with ±2% respectively. So this shows that a minor change has increased the conversion rate. If we ignore the margin of error, conversion rate for test variation A is 10% and conversion rate for test variation B is 20%, i.e. a 10% increase in the test variation.
Now, if we divide the difference by control variation rate 10% ÷ 10% = 1.0 = 100%, it shows an improvement of 100%. Hence, we can say that A/B Testing is a technique based on mathematical methods and analysis. There are various online tools that can be used to calculate A/B significance.
A/B Testing - Why to Use?
A/B Testing is used to make business decisions based on the results derived from data, instead of just making predictions. It allows you to create variations of your website or app and then helps you to confirm or discard your decision to make changes.
This testing allows you to optimize your site or app in such a way that it increases the conversion rates. A higher conversion rate means getting more value from your existing users instead of having to pay more on traffic acquisition. A/B Testing can also help you to change other factors in business like changing work culture, etc. It helps you to use mathematical data and statistics to determine the direction of your product variations.
Either you are a designer, a business analyst, or a developer, A/B Testing provides a simple way to use the power of data & statistics to reduce risks, improve results, and become more data-driven in your work.
To run an A/B Test, you should consider the following points −
Always perform A/B Testing if there is probability to beat the original variation by >5%.
Test should be run for a considerable amount of time, so that you should have enough sample data to perform statistics and analysis.
A/B Testing also enables you to gain maximum from your existing traffic on a webpage. The cost of increasing your conversion is minimal as compared to the cost of setting up the traffic on your website. The ROI (return on investment) on A/B Testing is huge, as a few minor changes on a website can result in a significant increase of the conversion rate.
A/B Testing - What to Test?
A/B Testing is about creating multiple variations of an application or a website and then comparing all these versions using samples to determine the best variation that has the maximum conversion rate. There are different types of variations, which can be applied to a web page or an application. A/B Testing is not limited to an application or a web page only, as you can create variations for other products as well. Anything on a web page that can affect the behavior of a visitor while browsing on the site can be tested using A/B Testing.
Here is a list of A/B Testing variations that can be applied on a web page −
- Headlines
- Sub headlines
- Images
- Texts
- CTA text and button
- Links
- Badges
- Media Mentions
- Social mention
- Sales promotions and offers
- Price structure
- Delivery options
- Payment options
- Site navigations and user interface
There are various tools that can be used to create variations that you will read in detail later in this tutorial.
A/B Testing – Process
A/B Testing comprises of a set of processes that one must follow sequentially in order to arrive at a realistic conclusion. In this chapter, we will discuss in detail the steps of A/B Testing process that you can use to run tests on any web page −
Background Research
Background research plays a critical role in A/B Testing. The first step is to find out the bounce rate of the website. This can be done with the help of several widely available background research tools like Google Analytics and others.
Collect Data
Data from Google Analytics can help you to find visitor behaviors on the websites. It is always advisable to collect enough data from the site. Try to find the pages with low conversion rates or high drop-off rates that can be further improved. Also calculate the number of visitors per day that are required to run this test on the website.
Set Business Goals
The next step is to set your business or conversion goals, which will help in understanding what the objective is. Once that is done, then you can find the metrics that determine whether or not a new version is more successful than its original version.
Construct Hypothesis
Once goal and metrics have been set for A/B Testing. The next step is to find ideas on how to improve the original version and how to make it better than the current version. Once you have a list of ideas, prioritize them in terms of expected impact and difficulty of implementation.
For example, one of the most effective thing is to add images to a site, which will help in reducing the bounce rate to some extent.
Create Variations/Hypothesis
There are many A/B Testing tools in the market that has a visual editor to make these changes effectively. The key decision to perform A/B Testing successfully is by selecting the correct tool. Some of the most commonly available tools are −
- Visual Website optimizer (VWO)
- Google Content Experiments
- Optimizely
There are different types of variations that can be applied to an object like using bullets, changing numbering of the key elements, changing the font and color, etc.
Running the Variations
Present all the variations of your website or app to the visitors. Their actions will be monitored for each and every variation. Furthermore, this visitor interaction for each variation is measured and compared to determine how a particular variation performs.
Analyze Data
Once this experiment is completed, the next step is to analyze the results. A/B Testing tool will present the data from the experiment and will tell you the difference between the performance and efficiency of different versions of a web page. It will also show if there is a significant difference between variations with the help of mathematical methods and statistics.
For example, if the images on the web page have reduced the bounce rate, you can add in more images to increase the conversion. If you see no change in bounce rate because of this, go back to the previous step to create a new hypothesis/variation to perform a new test.
A/B Testing - Collect Data
The data from Google Analytics can help you to find visitor behaviors. It is always advisable to collect enough data from the site. Try to find the pages with low conversion rates or high drop-off rates that can be improved. In this chapter, we will discuss a few tools which can be used to collect data for A/B Testing.
Google Analytics / Mix Panel (Analytics Tool)
Most of the websites have Google Analytics installed to get an idea of how visitors interact with the site. If you don’t have Google Analytics installed to monitor traffic, you can install it from the internet. Google Analytics is one of best analytic tools available for free.
To install Google Analytics on your website, you can simply copy the code and deploy it on your site and you will get a good amount of data to work with. You can also apply customization of the tool to meet your business goals.

Mouse Flow / Crazy Egg (Replay Tools)
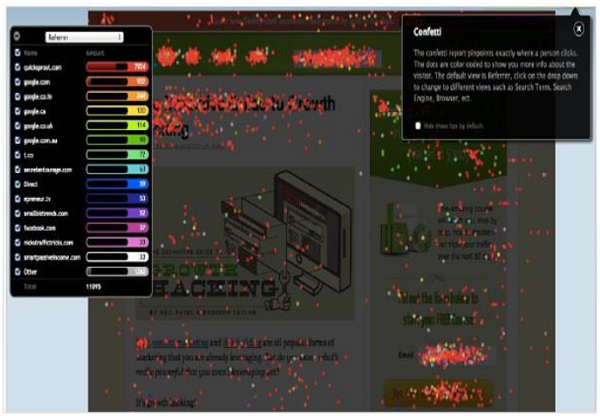
Replay tools are used to get a better insight of user actions on your website. It also allows you to click maps and heat maps of user clicks to check how far the users are browsing on the website.
Replay tools like Mouse Flow allows you to view a visitor's session in a way, as if you are with the visitor itself. Video replay tools give deeper insight into what it would be like for that visitor browsing the various pages on your website.
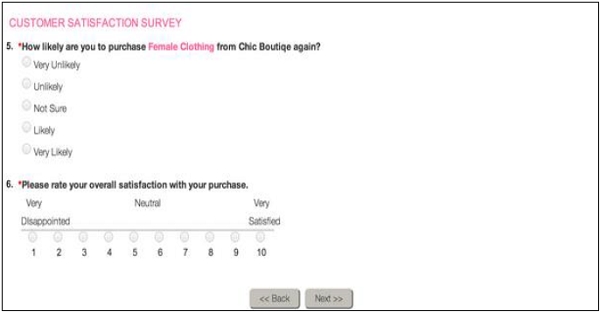
WebEngage (Survey Tools)
Survey tools are used to collect qualitative feedback from the website. This involves asking returning visitors some survey questions. This survey asks them general questions and also allows them to enter their views or select from pre-provided choices.
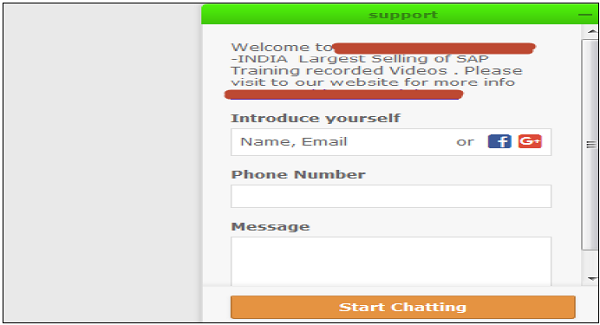
Other Tools – Chat, Email
Live chat facility allows visitor to get quick answers from customer service team and help resolve the situation faster. This also helps you to get the general questions from the visitors and to collect data for testing.
A/B Testing – Identify Goals
The next step is to set your conversion goals. Find the metrics that determine whether or not the variation is more successful than the original version. Goals come from your business objectives, so as an example, if you have to increase the sale of clothes in terms of objectives, it can be as −
- Clear product images.
- Increase site visit rates.
- Reduce shopping cart drop rate.
Next is to define metrics that meet your business goals. A metric becomes a KPI (Key Performance Indicator) only when it is measuring something connected to your objectives.
Example 1
Your Cloth store’s business goal is to sell clothes, so the KPI of this business goal could be the number of clothes sold online. You need to have your business objectives clearly defined otherwise you will not be able to identify your KPI’s. If you set the KPIs correctly and measure them periodically, you will keep your strategy on track to create variations and perform A/B Testing. Next is to find the target metrics for your business goals.
Example 2
Your cloth store sold 100 products last week. Is this OK or bad? For your KPIs to mean something for you, they need target metrics. Define a target for every KPI that is important to you. Once you define business goals and target metrics then you have a framework, which will help to determine if the work you will be doing is relevant to your business goals or not.
A/B Testing - Generate Hypothesis
After identifying your business goals, the next step is to generate A/B Testing ideas and hypothesis for why you think they will be better than the current version. Create a list of all hypothesis that you think you can create, prioritize all variations in terms of the expected impact and how to implement them using various tools.
Example
You can reduce the bounce rate by adding more images at the bottom. You can add links of various social sites to increase the conversion rate as well.
A/B Testing - Create Variations
As A/B Testing is about creating new versions of an application or a web page and then comparing all versions to see the conversion rate. You can improve the conversion rate by analyzing the statistics to check new variations.
There are different types of variations that can be applied to an object like using bullets, changing numbering of the key elements, changing the font and color, etc. There are many A/B Testing tools in the market that has a visual editor to make these changes effectively. The key decision to perform A/B Testing successfully is by selecting the correct tool. Some of the most commonly available tools are −
- Visual Website optimizer (VWO)
- Google Content Experiments
- Optimizely
Visual Website Optimizer (VWO)
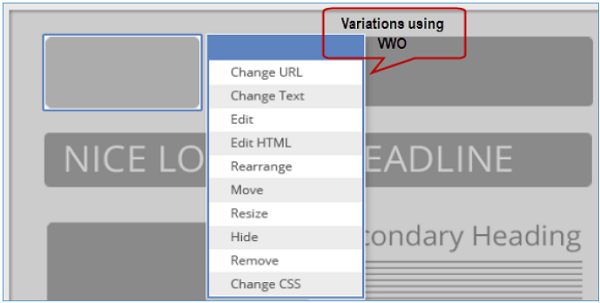
Visual Website Optimizer enables you to test multiple versions of a same page. It also contains ‘what you see is what you get’ (WYSIWYG) editor that enables you to make the changes and run tests without changing the HTML code of the page. You can update headlines, numbering of elements and run a test without making changes to IT resources.
To create variations in VWO for A/B Testing, open your webpage in the WYSIWYG editor and then you can apply the below changes to the web page −
- Change Text
- Change URL
- Edit /Edit HTML
- Rearrange
- Move
- Resize
- Hide
- Remove
- Change CSS
Google Content Experiments
This allows you to create up to five variations of any web page and then load all pages to Google Analytics to perform A/B Testing. Google Content Experiment is used to measure the results of all the variations and to decide the variant with the maximum conversion rate. The main advantage of using Google Content Experiments is that it is a freeware from Google, but you have to load the variants into Google Analytics to perform the test.
Optimizely
Optimizely is a tool used to perform A/B Testing, multivariate testing on a web page or on a mobile app and allows you to compare different versions of a web page or an application to determine, which variation provides a better conversion rate for your business.
This software can run on your webpage by executing a single line JavaScript snippet. Snippet is defined as single line code that will load Optimizely on your site and change the visitors experience on your website.
To test a mobile application using Optimizely, it runs via a Software Development Kit for iOS and/or Android. Optimizely running on your webpage collects data of site visitors and conversion rate and runs them on Stats Engine to determine, which variation is a winner or a loser. Once these stats are compared to target goals and set metrics, they help you to make decisions about the variation to be applied on the website.
Optimizely allows you to perform these tests −
- A/B Test that compares different URLs.
- A/B Test that runs across multiple pages, flows, etc.
- Run different variations for different set of audiences.
- To apply hot fixes on a webpage for all the visitors.
A/B Testing - Run Experiment
It involves presenting all variations of your website or an application to the visitors and their actions are monitored for each variation. Visitor interaction for each variation is measured and compared to determine how this variation performs.
As discussed in the previous chapter, there are various tools that can be used to generate hypothesis and to run the variations −
- Visual Website optimizer (VWO)
- Google Content Experiments
- Optimizely
Visual Website Optimizer
There are various A/B Testing tools that allows marketing professionals to create multiple variations of their web pages by using a point-and-click editor. It doesn’t require any HTML knowledge and you can check which version produces the maximum conversion rate or sales.
Executing VWO split testing software is very simple as you just need to copy paste the code snippet in your website and you can easily make it available to visitors. Visual Website Optimizer also provides an option of multivariate testing and contains other number of tools to perform behavioral targeting, heat maps, usability testing, etc.
There are multiple features in VWO that ensures all your conversion rate optimization activities are covered by this tool. Many enterprises and small scale online stores are using A/B Testing VWO software for landing page optimization and for increasing their website sales and improving conversion rates as well.
Company also provides a 30 days’ trial that can be downloaded free from − https://vwo.com/.
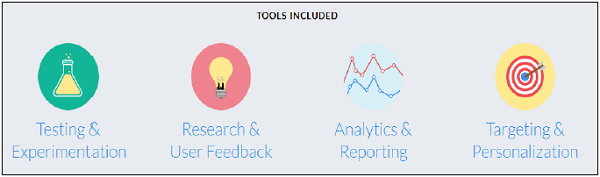
Some of the key features of VWO are as follows −
- Testing and Experimentation
- Visual Editor
- Analysis and Reporting
- Heat maps and Click maps
- Platforms and Integrations
How it works?
Optimizely running on your webpage collects data of site visitors, conversion rate and runs them on Stats Engine to determine, which variation is a winner and which one is a loser. Once these stats are compared with target goals and set metrics, it will help you to make decisions about the variation to be applied on the website.

Google Content Experiments
It allows you to create up to five variations of a web page and then load all these pages to Google Analytics to perform A/B Testing.
To start with Google Analytics, you need to have a Google Analytics account and a tracking code to be installed on your website. If you don’t have an account, you can sign up using the following tool − http://www.google.com/analytics/
Adding tracking code directly to a website
To complete this process, you must have access to your website source code, you should also be comfortable editing HTML (or have a webmaster/developer, who can help you with this), also you should have a Google Analytics account and property already set up.
To set up tracking code into your webpage
Find the tracking code snippet and sign in to your Google Analytics account, and select the Admin tab at the top.
Go to the ACCOUNT and PROPERTY tab, select the property you’re working with. Click on Tracking Info → Tracking Code. Image of where you find your tracking code in your Analytics account → Click to expand this image and see where these options appear in the interface.
Find your tracking code snippet. It's in a box with several lines of JavaScript in it. Everything in this box is your tracking code snippet. It starts with <script> and ends with </script>.
The tracking code contains a unique ID that corresponds to each Google Analytics property. Don’t mix up tracking code snippets from different properties, and don’t reuse the same tracking code snippet on multiple domains.
Copy the snippet and paste into every web page you want to track. Paste it immediately before the closing </head> tag.
If you use templates to dynamically generate pages for your site, you can paste the tracking code snippet into its own file, then include it in your page header.
Verify if the tracking code is working
You can verify if the tracking code is working, check real time reports, you can also monitor user activity as it happens. If you see data in these reports, it means that your tracking code is currently collecting the data.
Content Experiments
Content Experiments is one of the quickest method to test web pages - landing pages, homepage, category pages and it requires fewer code implementations. It can be used to create A/B Tests inside Google Analytics.
Some of the most common features of Content Experiments are −
You need to use original page script to run tests, the standard Google Analytics tracking code will be used to measure goals and variations.
Target goals that are defined on Google Analytics can be used as the experiment goal, including AdSense revenue.
The Google Analytics segment builder can be used to segment results based on any segmentation criteria.
It allows you to set tests that automatically expires after 3 months to prevent leaving tests running, if they are unlikely to have a statistically significant winner.
How to use Content Experiments to create A/B Tests?
Go to the Behavior section and click on the Experiments link. It will also show you a table with all the existing experiments. Click on the “Create experiment” option at the top of this table.
Enter → Name of the experiment, objective of the experiment, percentage of site traffic to take part, any mail notification for important changes, for distributing the traffic to all variations, set up time that experiment will run and also threshold values.
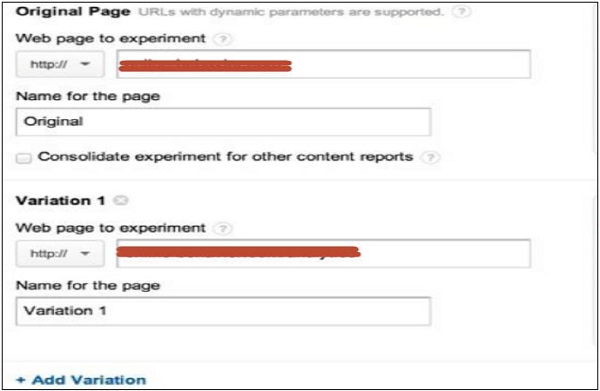
You can add URLs of original page and all the variations that you want to create and click on the next button. Select the implementation method and click on the next button → Click on validation (If you have one code implemented it will validate. If there is no code, it will show an error message) → Start Experiment.
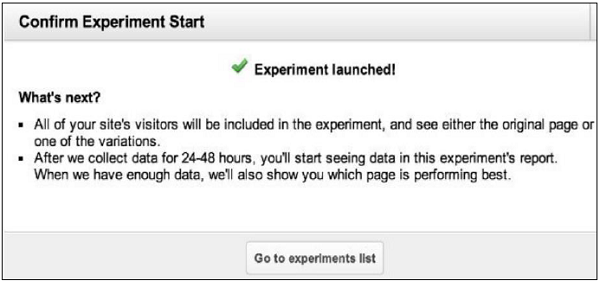
Once this experiment is run, you will see the following options −
Conversion Rate
Stop Experiment
Re-validate
Disable Variation
Segmentation − It allows you to see how each variation has performed for each segment of visitors on your webpage.
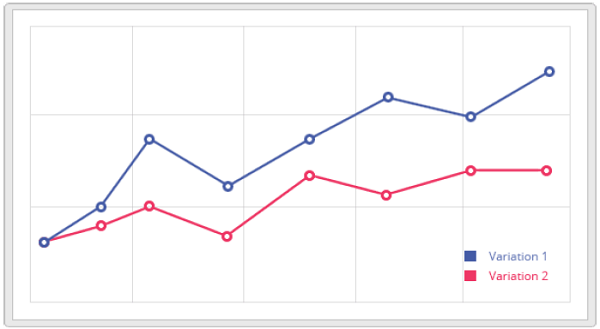
A/B Testing - Analyze Results
Once the experiment is completed, next step is to analyze the results. A/B Testing tool will present the data from the experiment and will tell you the difference between how the different variations on a web page performs, and also if there is a significant difference between variations, using the help of mathematical methods and statistics.
Example
If the images on a web page has reduced the bounce rate, you can decide whether it has a good conversion or not, once you upload more images on a web page. If you see no change in the bounce rate because of this, go back to the previous step and create a new hypothesis/variation to perform a new test.
Tools like VWO and Optimizely are used to run tests, but Google Analytics is best suited to run post-test analysis. This analysis is used to decide the way going forward. A/B Testing tools tell about the outcome of a test result, but there is a need to perform post analysis as well. To do post analysis you need to integrate each test with Google Analytics.
Both VWO and Optimizely provides built-in Google Analytics integration capability. The data for each test from both these tools should be sent to Google Analytics. By doing this, it enhances your analysis capabilities and ensures testing data. There is a possibility that your testing tool might be recording the data incorrectly, and if you have no other source for your test data, you can never be sure whether to trust it or not.
A/B Testing - Tools
There are various tools that can be used to generate hypothesis and to run the variations, these include −
- Visual Website optimizer (VWO)
- Google Content Experiments
- Optimizely
All these tools are capable to run A/B Tests and to find the winner, but to perform post analysis these tools should be integrated with Google Analytics.
A/B Testing – Google Analytics
Google Analytics has two options for analyzing the data −
- Universal Analytics
- Classic Google Analytics
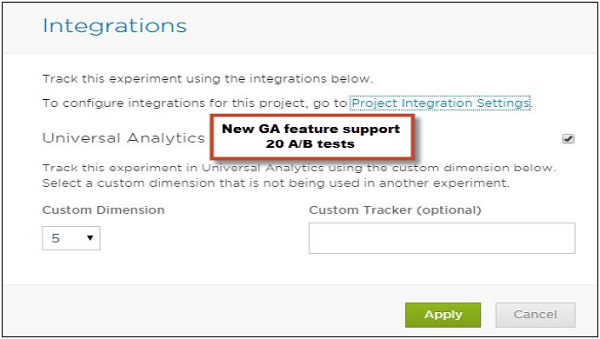
New Universal Analytics feature allow you to use 20 concurrent A/B Tests sending data to Google Analytics, however the Classic version allows only up to five.
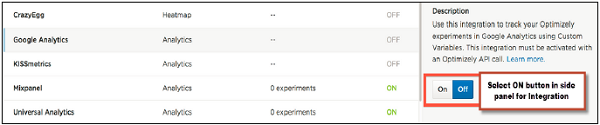
Integrating Optimizely with Google Universal Analytics
To integrate Optimizely in to Universal Google Analytics, first select the ON button on its side panel. Then you must have an available Custom to populate with Optimizely experiment data. Then the tracking code must be placed at the bottom of the <head> section of your pages. Google Analytics integration will not function properly unless the Optimizely snippet is above this Analytics snippet.
Configuration Steps
Optimizely uses Universal Google Analytics' "Custom Dimensions" to tag your visitors with the experiments and variations to which they've been added. Configuring Optimizely to begin sending this information to Universal Analytics requires four steps −
Step 1
Add the following JavaScript code to your site wherever the Universal Analytics code exists after the ga('create'...) function fires and before the Universal Analytics ga('send','pageview') function fires and the tracking call is made (see details in the next section) −
// Optimizely Universal Analytics Integration
window.optimizely = window.optimizely || [];
window.optimizely.push("activateUniversalAnalytics");
Step 2
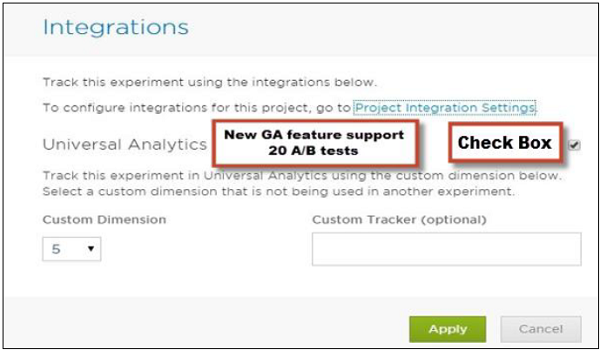
In the Optimizely Editor, go to Options → Integrations then click on the Universal Analytics checkbox to enable the integration.
Step 3
Select the custom dimension you would like Optimizely to use. You have to ensure that the Custom Dimension should not be in use already by any other part of your site, or by another currently-running Optimizely experiment.
Step 4
Select a Custom Tracker if you are using a custom event tracker other than the default. This will change Optimizely's integration call to use the custom tracker rather than the default.
Example
Let us say your website is using the following call −
ga('tracker3.send', 'pageview');
In this case you will be entering tracker3 in specifying a custom tracker field, and Optimizely would integrate with tracker3 instead of the default tracker.
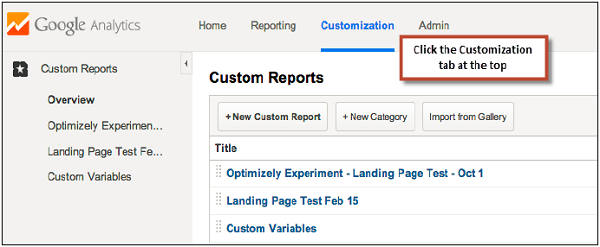
Creating a Custom Report using Google Analytics
First step is to log into your Universal Analytics account and click the Customization tab at the top. You should see a Custom Reports list.
Next is to set up a Custom Report for each experiment that you have integrated Universal Analytics with.
Click on the New Custom Report → Enter the report title and add the metric groups you wish to view in the report.
To filter this report for only your Optimizely experiment, choose the Custom Dimension you set up previously as one of the Dimension Drilldowns.
Add this dimension in the Filters section and use a Regex match on the experiment ID for the experiment you want to filter.
Click on Save.
A/B Testing - Multivariate
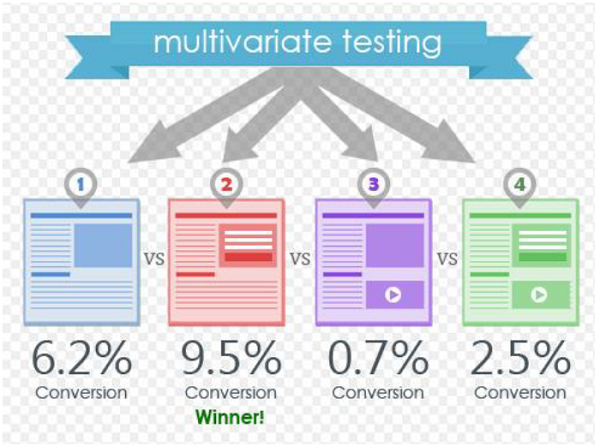
Like A/B Testing, Multivariate Testing is based on the same mechanism, but it compares higher number of variables, and provides more information about how these variables behave. In A/B Testing, you split the traffic of a page between different versions of the design. Multivariate Testing is used to measure the effectiveness of each design.
Example
Let us say there is a webpage that has received enough traffic to run the test. Now the data from each variation is compared to check the most successful variation, but it also includes the elements, which have the maximum positive or negative impact on a visitor's interaction.
Advantages of using Multivariate
Multivariate Testing is an effective tool to help you target as well as redesign the elements of your page and show the areas that will have the most impact. Multivariate method is useful for creating landing page campaigns.
Example
Data about the impact of a certain element's design can be applied to future campaigns, even if the context of the element has changed.
Limitations
Limitations of Multivariate testing is the traffic needed to complete the test. As all the experiments are fully factorial, too many changing elements at once can quickly add up to a very large number of possible combinations that must be tested. Even a site with fairly high traffic might have trouble completing a test with more than 25 combinations in a feasible amount of time.
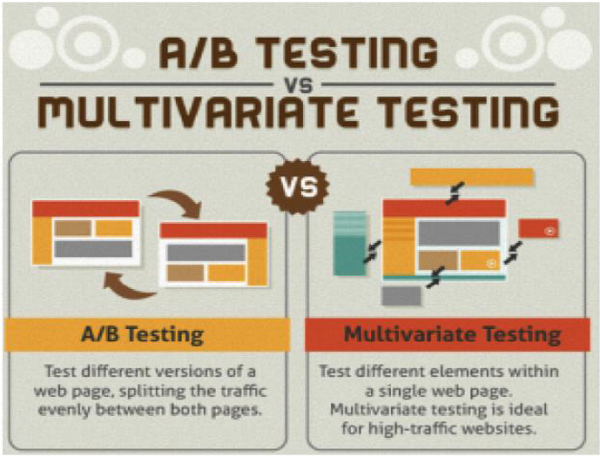
Difference between Multivariate and A/B Testing
A/B Testing also known as Split Testing is a method of website optimization, where you compare the conversion rates of two versions of a page namely, A and B. All visitors are divided into one version or the other. Once the visitors visit either of these versions (A or B), they click on various buttons or even sign-up for the newsletter. This allows you to determine which version of the page is more effective.
A/B Testing - SEO
SEO is a method to display your website at the top of the page, when a search is performed for those relevant items. It includes the information that your website offers to the visitors and why webpage content is relevant to come at the top in a search result. Many potential customers feel that A/B Testing or Multivariate Testing will have an effect on their search engine rankings.
There are four ways that ensure you to run A/B Tests without worrying about losing the potential SEO Value.
Don’t Cloak
Cloaking is called when you show one version of your webpage to Googlebot agent and other version to your website visitors. Google says that you shouldn’t cloak and is very strict with this. It can even lead to your website being excluded from the search results or demoted in SEO ranking. You have to ensure that you don’t divide your visitors among the different versions of your A/B Test based on a user agent. Google doesn’t care if their bot sees one version or another, it just cares that its bot has the same user experience as that of a random visitor.
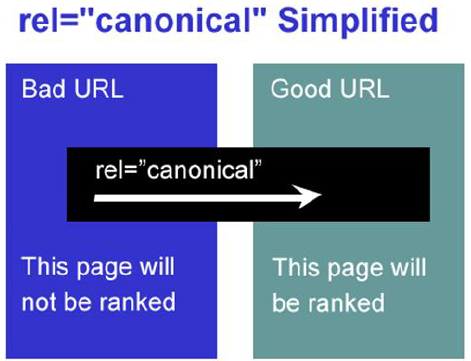
Use ‘rel=canonical’
When you have A/B Tests with multiple URL’s, you can add ‘rel=canonical’ to the webpage to indicate to Google, which URL you want to index. Google suggests to use canonical element and it’s a noindex tag as it is more in line with its intention. You are only indicating about which content is original. In this way Google can group and index pages accordingly.
Note − If it is not possible to use canonical, then you have to ensure that there is a noindex tag in HTML or HTTP Header, if not you should ensure it at least has a robots.txt.
Use 302 redirects and not 301’s
Google recommends to use the temporary direction method − a 302 over the permanent 301 redirect. As in any A/B Test, it is not a permanent relocation, but just a temporary one. It is always advisable to use 302 redirect as it is a notice of a temporary redirect. So if you’re using a redirect for A/B Testing, make sure you use a 302 header.
Most important point to consider for SEO is that you have to make it clear to search engines that they shouldn’t remove your original URL from their index and just put it temporarily on the hold. When the spiders come back for their next indexation, they will check again, if the redirect is still applicable, and if not, the old URL will be restored again.
Don’t run experiments for a longer period of time
Please note that when your A/B Test is completed, you should remove the variations as soon as possible and make changes to your webpage and start using the winning conversion. You have to ensure that you remove all the elements of the tests − like alternative URLs and test scripts.
If you run the test for a longer period, Google takes this as a way to fool search engines. This can happen when you are showing a test variant to a large number of visitors for a longer period of time.
A/B Testing - Interview Questions
A/B Testing (also known as Split testing) defines a way to compare two versions of an application or a web page that enables you to determine, which one performs better. A/B Testing is one of the easiest ways, where you can modify an application or a web page to create a new version and then comparing both these versions to find the conversion rate. This also lets us know, which is the better performer of the two.
The number of samples depend on the number of tests performed. The count of conversion rate is called a sample and process of collecting these samples is called sampling.
Confidence interval is called measurement of deviation from the average on the multiple number of samples. Let us assume that 22% of people prefer product A, with +/- 2% of confidence interval. This interval indicates the upper and lower limit of the people, who opt for Product A and is also called margin of error. For best results in this average survey, the margin of error should be as small as possible.
Always perform A/B Testing if there is probability to beat the original variation by >5%. Test should be run for considerable amount of time, so that you should have enough sample data to perform statistics and analysis. A/B Testing also enables you to gain maximum from your existing traffic on a webpage.
The cost of increasing your conversions is minimal as compared to the cost of setting up the traffic on your website. The ROI (return on investment) on A/B Testing is huge, as a few minor changes on a website can result in a significant increase of the conversion rate.
Like A/B Testing, Multivariate testing is based on the same mechanism, but it compares higher number of variables, and provides more information about how these variables behave. In A/B Testing, you split the traffic of a page between different versions of the design. Multivariate testing is used to measure the effectiveness of each design.
The problem with testing multiple variables at once is that it would be tough to accurately determine which of these variables have made the difference. While you can say one page performed better than the other, if there are three or four variables on each, you can’t be certain as to why one of those variables is actually a detriment to the page, nor can you replicate the good elements on other pages.
Here are a few A/B Testing variations that can be applied on a web page. The list includes − Headlines, Sub headlines, Images, Texts, CTA text and button, Links, Badges, Media Mentions, Social mention, Sales promotions and offers, Price structure, Delivery options, Payment options, Site navigations and user interface.
Background Research − First step in A/B Testing is to find out the bounce rate on your website. This can be done with the help of any tool like Google Analytics.
Collect Data − Data from Google Analytics can help you to find visitor behaviors. It is always advisable to collect enough data from the site. Try to find the pages with low conversion rate or high drop-off rates that can be improved.
Set Business Goals − Next step is to set your conversion goals. Find the metrics that determines whether or not the variation is more successful than the original version.
Construct Hypothesis − Once the goal and metrics have been set for A/B Testing, next is to find ideas to improve the original version and how they will be better than the current version. Once you have a list of ideas, prioritize them in terms of expected impact and difficulty of implementation.
Create Variations/Hypothesis − There are many A/B Testing tools in the market that has a visual editor to make these changes effectively. The key decision to perform A/B Testing successfully is by selecting the correct tool.
Running the Variations − Present all variations of your website or an app to the visitors and their actions are monitored for each variation. Visitor interaction for each variation is measured and compared to determine how that variation performs.
Analyze Data − Once an experiment is completed, next is to analyze the results. A/B Testing tool will present the data from the experiment and will tell you the difference between how the different variations of web page is performed. Also if there is any significant difference between variations with the help of mathematical methods and statistics.
The most common type of data collection tools includes the Analytics tool, Replay tools, Survey tools, Chat and Email tools.
Replay tools are used to get better insight of user actions on your website. It also allows you to click maps and heat maps of user click and to check how far user is browsing on the website. Replay tools like Mouse Flow allows you to view a visitor's session in a way you are with the visitor.
Video replay tools give deeper insight into what it would be like for that visitor browsing the various pages on your website. The most commonly used tools are Mouse Flow and Crazyegg.
Survey tools are used to collect qualitative feedback from the website. This involves asking returning visitors some survey questions. The survey asks them general questions and also allows them to enter their views or select from pre-provided choices.
You can reduce the number of bounce rate by adding more images at the bottom. You can add links of social sites to further increase the conversion rate.
There are different types of variations that can be applied to an object like using bullets, changing numbering of the key elements, changing the font and color, etc. There are many A/B Testing tools in the market that has a visual editor to make these changes effectively. The key decision to perform A/B testing successfully is by selecting the correct tool.
Most commonly available tools are Visual Website Optimizer, Google Content Experiments and Optimizely.
Visual Website Optimizer or VWO enables you to test multiple versions of the same page. It also contains ‘what you see is what you get’ (WYSIWYG) editor that enables you to make the changes and run tests without changing the HTML code of the page. You can update headlines, numbering of elements and run a test without making changes to IT resources.
To create variations in VWO for A/B Testing, open your webpage in WYSIWYG editor and you can apply many changes to any web page. These include Change Text, Change URL, Edit /Edit HTML, Rearrange and Move.
Visual Website Optimizer also provides an option of multivariate testing and contains other number of tools to perform behavioral targeting, heat maps, usability testing, etc.
These tests can be applicable on several other places like Email, Mobile Apps, PPC and CTAs as well.
Once an experiment is completed, next is to analyze the results. A/B Testing tool will present the data from the experiment and will tell you the difference between how the different variations of that web page are performed. It will also show if there is a significant difference between variations using mathematical methods and statistics.
To integrate Optimizely to Universal Google Analytics, first select the ON button on the side panel. Then you must have an available Custom to populate with Optimizely experiment data.
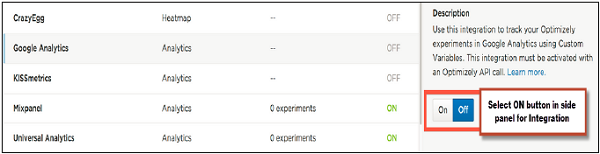
The Universal Google Analytics tracking code must be placed at the bottom of the <head> section of your pages. Google Analytics integration will not function properly unless the Optimizely snippet is above the Analytics snippet.
Google Analytics has two options for analyzing the data, which are Universal Analytics and Classic Google Analytics. New Universal Analytics features allow you to use 20 concurrent A/B tests sending data to Google Analytics, however the Classic version allows only up to five.
This is a myth that A/B Testing hurts search engine rankings because it could be classified as duplicate content. The following four ways can be applied to ensure that you don’t lose the potential SEO value, while running A/B Tests.
Don’t Cloak − Cloaking is when you show one version of your webpage to Googlebot agent and other version to your website visitors.
Use ‘rel=canonical’ − When you have A/B Tests with multiple URL’s, you can add ‘rel=canonical’ to the webpage to indicate to Google which URL you want to index. Google suggests to use canonical element and not noindex tag as it is more in line with its intention.
Use 302 redirects and not 301’s − Google recommends to use the temporary direction method − a 302 over the permanent 301 redirect.
Don’t run experiments for a longer period of time − Please note that when your A/B Test is completed, you should remove the variations as soon as possible and make changes to your webpage and start using the winning conversion.