- A/B Testing Tutorial
- A/B Testing - Home
- A/B Testing - Overview
- A/B Testing - How it Works
- A/B Testing - Why to Use?
- A/B Testing - What to Test?
- A/B Testing - Process
- A/B Testing - Collect Data
- A/B Testing - Identify Goals
- A/B Testing - Create Variations
- A/B Testing - Run Experiment
- A/B Testing - Analyze Results
- A/B Testing - Tools
- A/B Testing - Multivariate
- A/B Testing - SEO
- A/B Testing - Interview Questions
- A/B Testing Useful Resources
- A/B Testing - Quick Guide
- A/B Testing - Useful Resources
- A/B Testing - Discussion
A/B Testing - How it Works
You can monitor the visitor’s actions using statistics and analysis to determine the version that yields a higher conversion rate. A/B Testing results are usually given in fancy mathematical and statistical terms, but the meaning behind the numbers are actually quite simple. There are two significant methods through which you can check conversion rates using A/B Testing −
- Sampling of Data
- Confidence Intervals
Let us discuss these two methods in detail.
Sampling of Data
The number of samples depend on the number of tests performed. The count of conversion rate is called a sample and the process of collecting these samples is called as sampling.
Example
Let us say you have two products A and B, you want to collect sample data as per its demand in the market. You can ask a few people to choose from product A and B and then request them to participate in a survey. As the number of participant’s increase, it will start showing a realistic conversion rate.
There are various tools that can be used to determine the correct number of sample size. One such free tool available is −
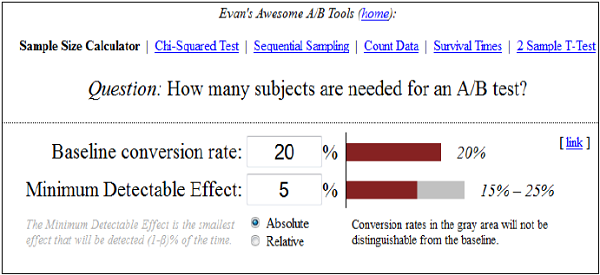
Confidence Intervals in A/B Testing
Confidence interval is the measurement of deviation from the average on the multiple number of samples. Let us assume that 22% of people prefer product A in the above example, with ±2% of confidence interval. This interval indicates the upper and lower limit of the people, who opt for Product A and is also called as margin of error. For best results in this average survey, the margin of error should be as small as possible.
Example
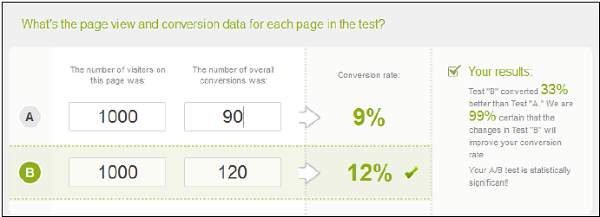
Let us assume that in Product B, we have added a minor change and then performed A/B Testing on these two products. Confidence interval product A and B are 10% with ±1% and 20% with ±2% respectively. So this shows that a minor change has increased the conversion rate. If we ignore the margin of error, conversion rate for test variation A is 10% and conversion rate for test variation B is 20%, i.e. a 10% increase in the test variation.
Now, if we divide the difference by control variation rate 10% ÷ 10% = 1.0 = 100%, it shows an improvement of 100%. Hence, we can say that A/B Testing is a technique based on mathematical methods and analysis. There are various online tools that can be used to calculate A/B significance.